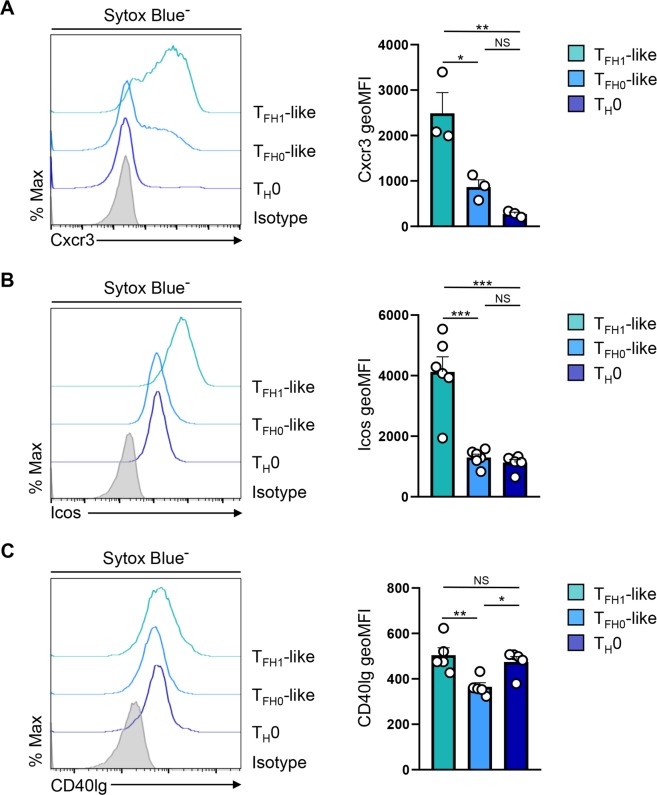
Figure 2.
TFH1-like cells express elevated levels of Cxcr3, ICOS, and CD40 ligand. (A) Flow cytometry analysis of Cxcr3 surface expression on the indicated T helper cell populations. Mean fluorescence intensity (MFI) is also shown (mean of n = 3 ± s.e.m.). (B) Flow cytometry analysis of ICOS and CD40 ligand surface expression by the indicated T helper cell populations. Mean fluorescence intensity (MFI) is also shown (mean of n = 5–6 ± s.e.m.). *P < 0.05, **P < 0.01, ***P < 0.001; one-way ANOVA with Tukey multiple-comparison test.

