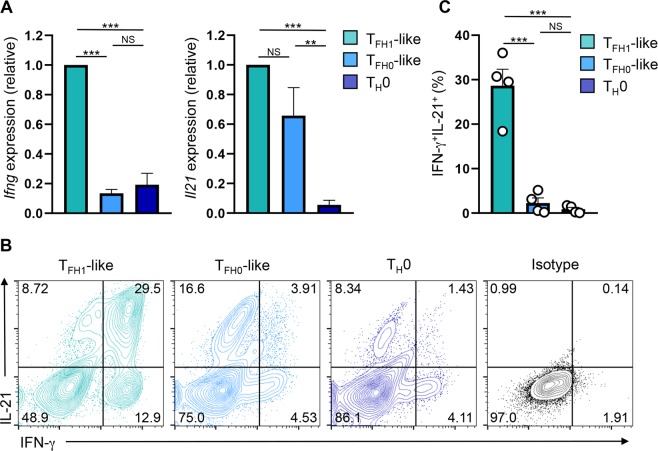
Figure 3.
TFH1-like cells express both IFN-γ and IL-21. (A) qRT-PCR analysis of Ifng and Il21 expression in the indicated cell populations following stimulation with PMA/Ionomycin for 2.5 hrs. The data were normalized to Rps18 and presented as fold change relative to the TFH1-like sample (mean of n = 5 ± s.e.m.). (B) Flow cytometry analysis of intracellular expression of IL-21 and IFN-γ in the indicated cell populations. Shown are representative data from four independent experiments. (C) Percentage of IFN-γ+IL-21+ cells as assessed by flow cytometry analysis (mean of n = 4 ± s.e.m.). **P < 0.01, ***P < 0.001; one-way ANOVA with Tukey multiple-comparison test.

