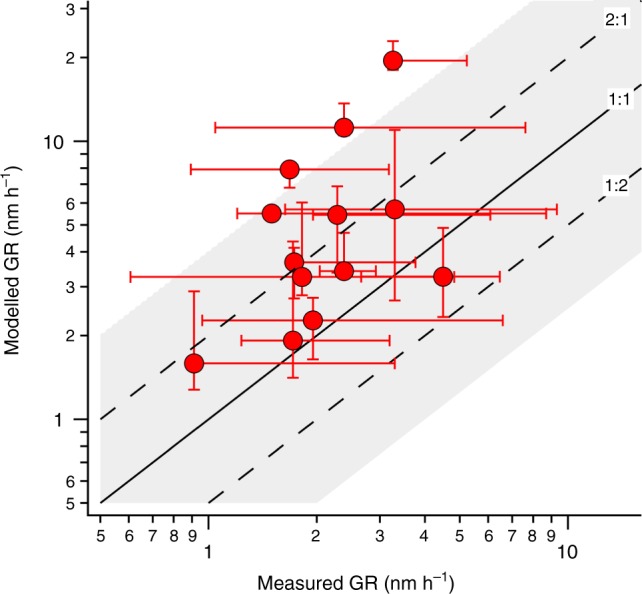
Fig. 3.

Modeled vs measured growth rates (GR) for all 13 new particle formation events (3–30 nm). Modeled GR are calculated over the growth from 3 to 30 nm by a linear fit to the diameter as a function of time. The error bars for the modeled GR represent the variation in GR if it is calculated as a fit to different size ranges (3–5 nm, 5–10 nm, 10–20 nm, and 20–30 nm). The measured GR are calculated from particle size distributions by a linear fit to the nucleation mode peak diameter as a function of time. The error bars for the measured GR represent the variation in the growth rate when the linear fit is performed on mode peak diameters from different time intervals of the observed nanoparticle growth
