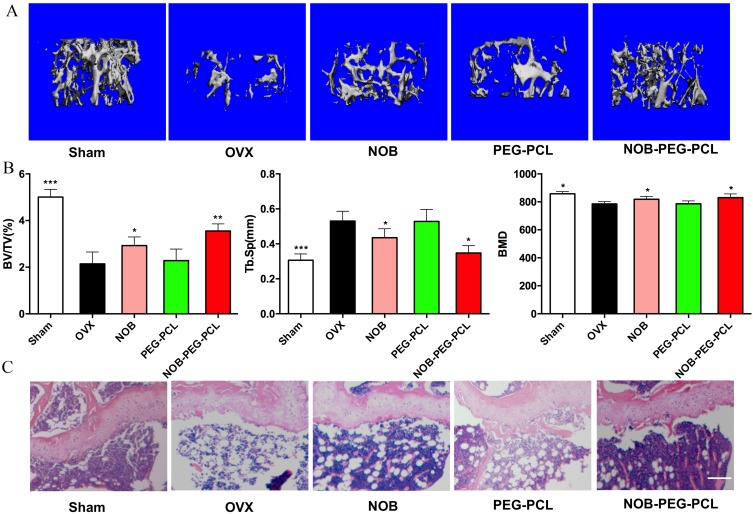
Figure 7.
Anti-osteoporosis of NOB-PEG-PCL micelles. (A) 3D image of the same position of femur head in the bone of sham, OVX, NOB, PEG-PCL, and NOB-PEG-PCL groups. Bar =1 mm. (B) bone volume/tissue volume (BV/TV), trabecular space (Tb.Sp), and bone mineral density (BMD) in the bone of sham, OVX, NOB, PEG-PCL, and NOB-PEG-PCL groups after 8 weeks treatment (mean ± SD). *Represents p<0.05 compared with OVX group. **Represents P<0.01 compared with OVX group. ***Represents p<0.001 compared with OVX group. (C) Histological analysis of femur from all experimental groups. Bar =100 μm.

