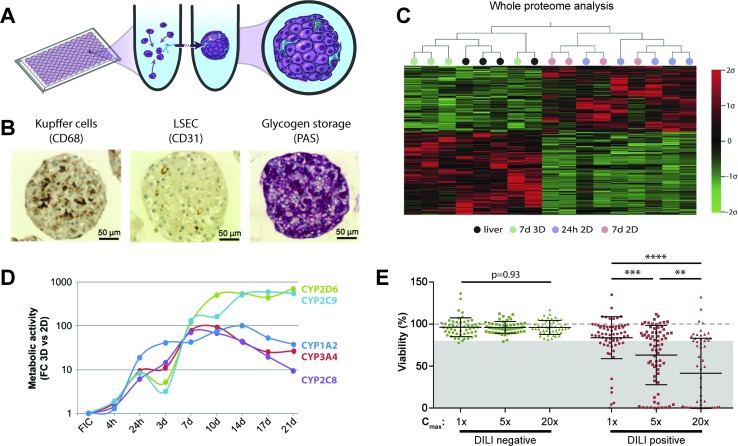
Figure 2.
Primary human hepatocyte spheroids in chemically defined medium for DILI prediction. (A) Schematic representation of the spheroid formation process in ultra-low attachment plates. (B) Immunohistochemistry for CD68 and CD31 reveals presence of Kupffer cells and liver sinusoidal endothelial cells (LSEC). Periodic acid schiff (PAS) staining demonstrates glycogen storage capacity of PHH spheroids. (C) Mean-centered, sigma-normalized heatmap visualization of whole proteome data indicates that the proteomic signatures of PHH spheroids (7d 3D) closely resemble the proteomes of the corresponding human livers, whereas 574 proteins are differentially expressed in monolayer culture at different time points (24 h 2D and 7 days 2D). (D) Comparison of CYP metabolism determined by mass spectrometry between 2D and 3D spheroid cultures of the same donors (n = 3) demonstrates that metabolic activities are 10–900-fold higher in 3D PHH spheroids after one or more weeks in culture. FC: fold change; FIC: freshly isolated cells. (E) Toxicity assessment of 70 hepatotoxic drugs (DILI positive; red dots) and 53 DILI negative controls in PHH spheroids (green dots). Viability as determined by ATP quantifications relative to untreated controls is shown for three exposure levels (1×, 5×, and 20× therapeutic cmax). The dashed line indicates viability of the respective control spheroids (100%). Notably, of the 70 compounds with DILI liabilities in humans, 48 of the 70 DILI positive compounds were successfully flagged as toxic (69% sensitivity), whereas none of the DILI negative drugs indicated hepatotoxic liabilities (100% specificity). Error bars indicate SD **, ***, and **** indicate p < 0.01, p < 0.001, and p < 0.0001 in a two-tailed heteroscedastic t-test, respectively. Figure modified with permission from (24, 58, 59; 61, 69).

