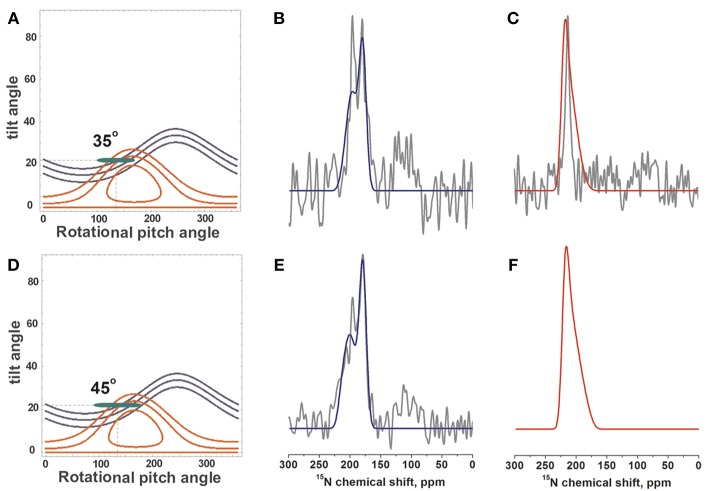
Figure 6.
Simulations of 15N-DQB1 solid-state NMR spectra. When the DQB1 helix exhibits a tilt/pitch angular pair of 22°/135° with a range of alignments in slow exchange spectral line shapes and chemical shifts are observed which approximate the experimental spectra of Figures 1C,D, 2A (shown in gray). The Gaussian distribution of alignments exhibits a SD of 1° for the tilt and 35° for the pitch to reproduce the experimental spectra of 1 mole% DQB1 (A–C) or 45° for the experimental spectra of 2 mole% DQB1 (D–F), respectively. (B,E) compare to the experimental spectra of 15N-L15, (C) to that of 15N-V14. The alignments that entered the simulation are shown in the contour plots (A,D) by the green ellipses.

