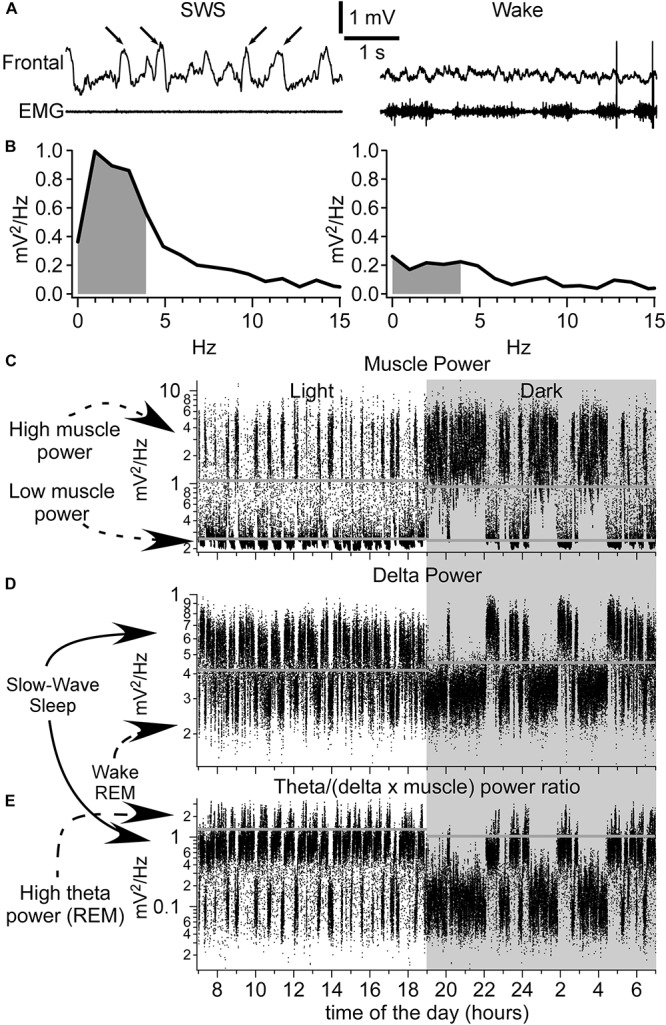
FIGURE 1.

Identification of sleep–wake states. (A) A segment of LFP recorded from the frontal cortex and EMG (neck muscle) during slow-wave sleep (left panel, arrows indicate the slow waves) and wake (right panel). Below are the corresponding FFT analysis (B). Gray indicates the area used to calculate the delta power (0.2–4 Hz). (C) Muscle power over 24 h. Shaded area indicates the dark period. (D) Delta power pattern for 24 h. Each dot represents 5 s of recordings. Note the bimodal distribution pattern of delta power with high delta power values corresponding to slow-wave sleep and low delta power values corresponding to either wake or REM sleep. (E) Calculated ratio over 24 h of theta power divided by the delta power and further divided by the muscle power. High ratio values correspond to REM sleep having a high theta power, and low delta and muscle powers. Horizontal gray lines correspond to threshold values set for shown examples. Note that the thresholds were different for recordings obtained during light phase vs. dark phase.
