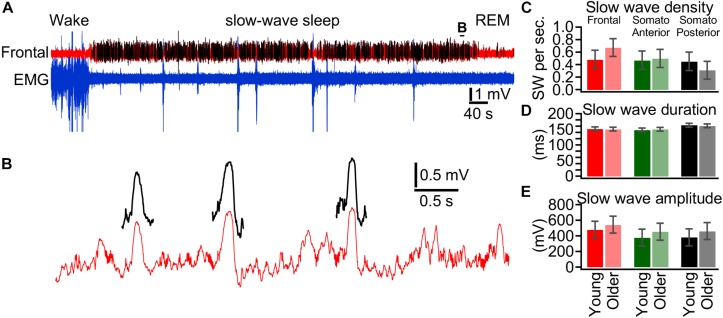
FIGURE 5.
Slow wave features in young and older mice. (A) Segment of LFP recording from the frontal cortex (red trace) and EMG from neck muscle (blue trace). Slow waves are detected using a neural network approach and detected slow waves are depicted by black traces. (B) Expanded segment from (A) as indicated. (C) Slow wave density detected during slow-wave sleep over a 24 h period for young (bright colors, n = 18 days from nine mice) and older (light colors, n = 18 days from eight mice). (D) Duration of detected slow waves, (E) Amplitude of detected slow waves.

