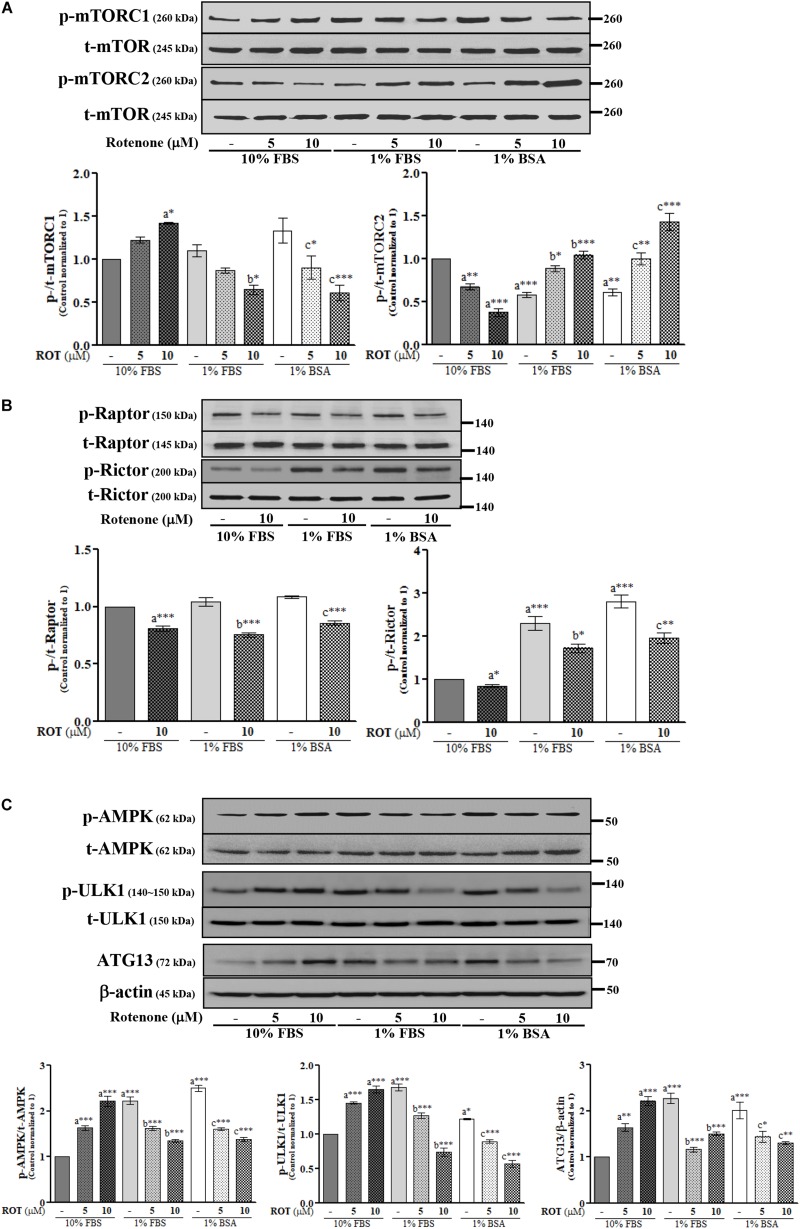
FIGURE 2.
SH-SY5Y cells were seeded as 1 × 10⁵ cells/ml of DMEM containing 10% FBS or 1% FBS or 1% BSA and used for experiments after overnight incubation. Cells were incubated with the absence or presence of ROT (0, 5, and/or 10 μM) for 24 h and assessed for mTOR (A,B) and AMPK (C) signaling proteins and β-actin by Western blotting. Each picture is a representative of three independent experiments. Data are mean ± SEM of three independent experiments and analyzed by one-way of variance (ANOVA) followed by Tukey’s post hoc test. Statistical significance: acompared with 10% FBS control; bcompared with 1% FBS control; ccompared with 1% BSA control; ∗p < 0.05, ∗∗p < 0.01, and ∗∗∗p < 0.001.

