
FIGURE 6.
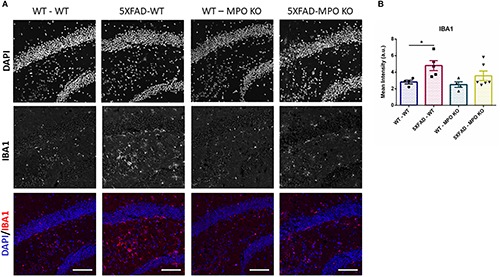
Low IBA1 expression in 5XFAD MPO KO mice. Representative images of hippocampal slices stained with IBA1 (A). Quantification of S100β mean intensity (B). Scale bar = 200 μm. Data are mean ± SEM. ∗P < 0.05. Two-tailed Mann-Whitney test.
Official websites use .gov
A
.gov website belongs to an official
government organization in the United States.
Secure .gov websites use HTTPS
A lock (
) or https:// means you've safely
connected to the .gov website. Share sensitive
information only on official, secure websites.
Low IBA1 expression in 5XFAD MPO KO mice. Representative images of hippocampal slices stained with IBA1 (A). Quantification of S100β mean intensity (B). Scale bar = 200 μm. Data are mean ± SEM. ∗P < 0.05. Two-tailed Mann-Whitney test.