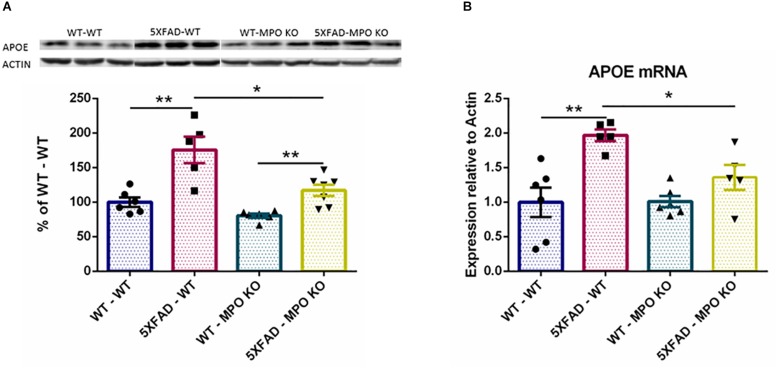
FIGURE 8.
Low APOE levels in 5XFAD MPO KO mice. Western blot analysis of hippocampal cell lysates probed with anti APOE antibody (A). Entire Gel image is shown in Supplementary Figure S1. mRNA expression analysis of APOE in hippocampal samples (B). Data are mean ± SEM. For western blot analysis, data are represented as % of each sample to the WT-WT group average. ∗P < 0.05 and ∗∗P < 0.01. Two-tailed Mann-Whitney test.

