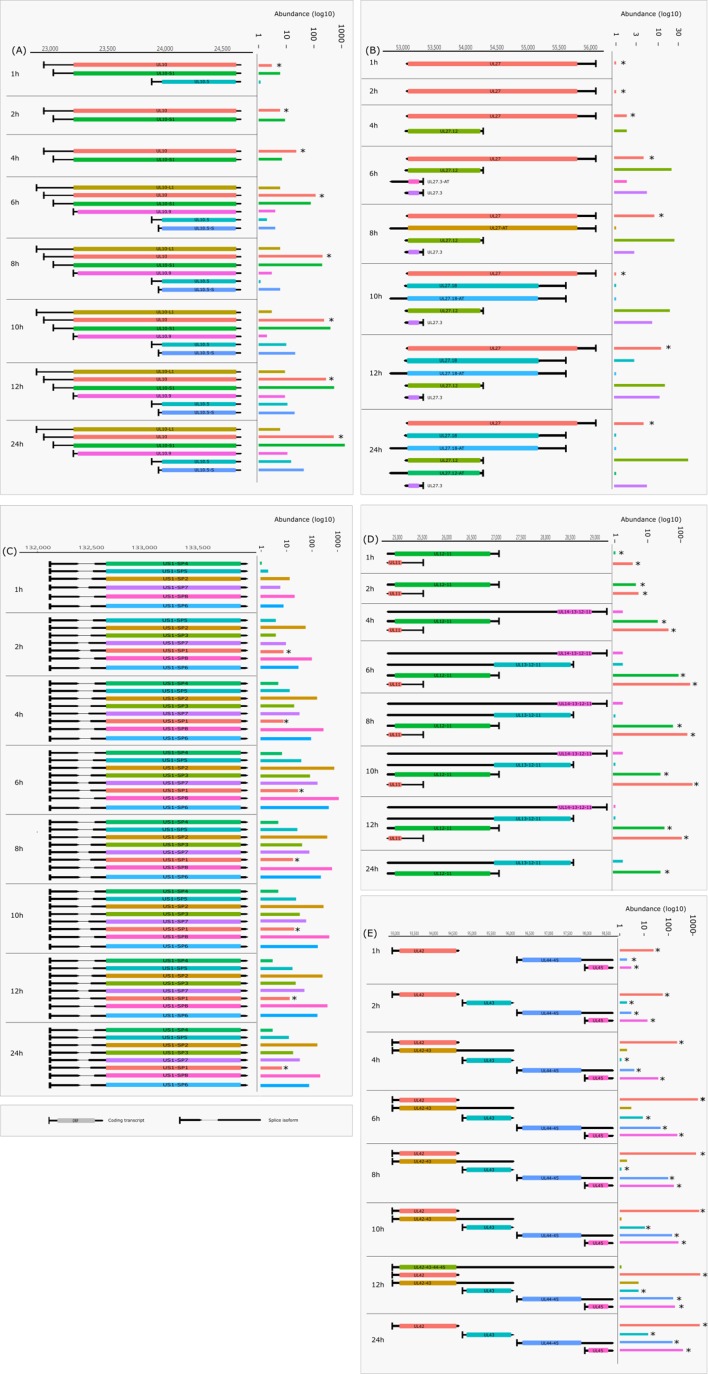
Figure 9.
Dynamic HSV-1 transcriptome—examples. The structure of transcript isoforms and of their position on the HSV-1 genome is shown by the annotations, while their abundance in distinct time points of the infection is represented on a log10 scale by bar plots on the right side of the annotation. Transcripts annotated in other works are marked with an asterisk (*). Transcript structures and counts were determined using the LoRTIA software suite. (A) The change in abundance of the 5’-UTR and 5’ truncated isoforms of UL10. (B) Expression of UL27 RNA and its isoforms, including those with alternative termination. (C) Transcription kinetics of the US1 splice variants. (D) The change in abundance of polycistronic and monocistronic transcripts in the coterminal transcript at the UL11-UL14 region. (E) Transcription kinetics abundance of polycistronic and monocistronic transcripts in the UL42-UL45 region. Some of these transcripts are coterminal, while others have alternative terminations.

