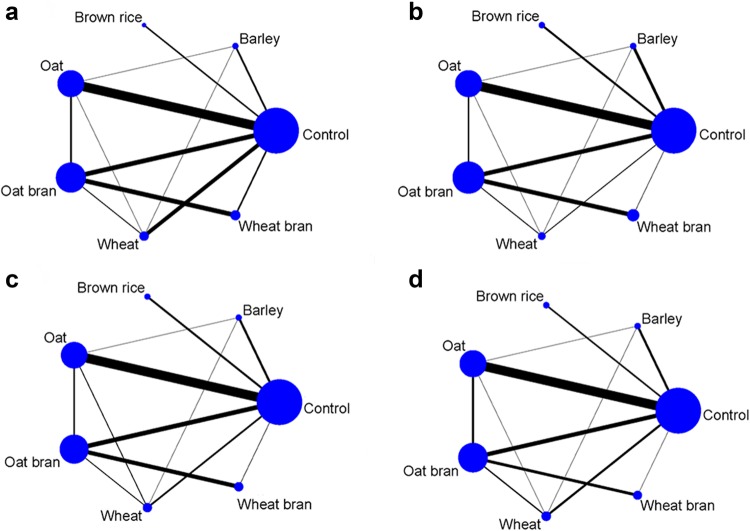
Fig. 2.
Network plots of eligible comparisons for different whole grains and brans for TC (a), LDL-C (b), HDL-C (c) and TG (d). Lines connect the interventions that have been studied in head-to-head (direct) comparisons in the eligible studies. The sizes of the nodes are weighted according to the number of trials that study the intervention, and the thickness line corresponds to the number of trials that assess direct comparisons between different interventions

