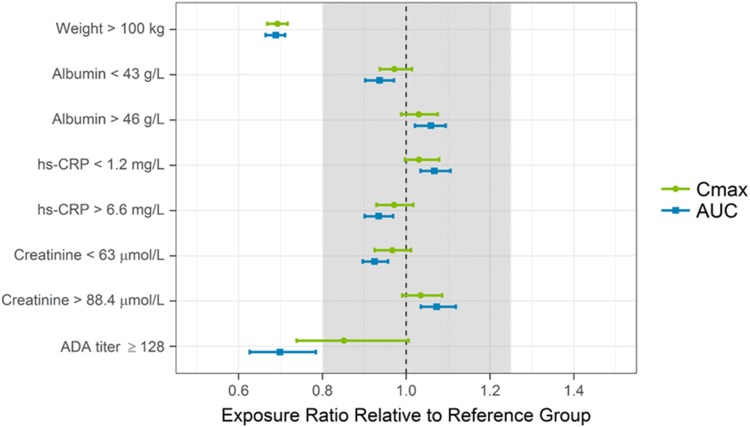
Fig. 3.
Impact of covariates on risankizumab exposures. Points and squares represent median values and error bars represent 95% confidence intervals of the normalized exposure ratios across 200 simulation replicates. The vertical black dashed line shows an exposure ratio of 1 relative to the reference group, and the shaded area represents the 0.8–1.25 default equivalence boundaries. ADA antidrug antibody, AUC area under the concentration–time curve between weeks 40 and 52, Cmax maximum concentration, hs–CRP high-sensitivity C-reactive protein

