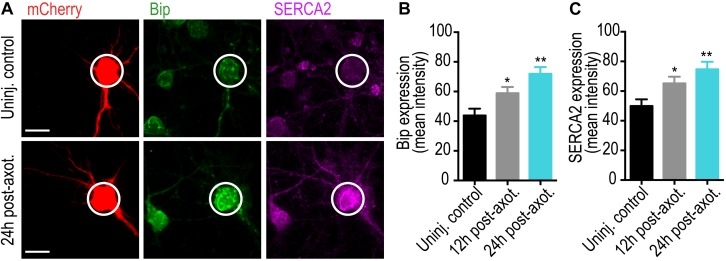
FIGURE 6.
Axotomy induces somatic ER changes within our microfluidic model. (A) Representative images of retrograde labeled mCherry neurons co-immunostained with the Ca2+ binding protein and ER stress marker, GRP78/BiP, and the ER Ca2+ pump, SERCA2. Scale bar, 10 μm. White circles highlight the soma of axotomized and uninjured control neurons. Quantification of somatic BiP (B) and SERCA2 (C) expression at 12 and 24 h post-axotomy are indicative of changes in somatic Ca2+ homeostasis. N = 18 neurons; 2 chambers per condition. Error bars, SEM. ∗p < 0.05, ∗∗p < 0.005.

