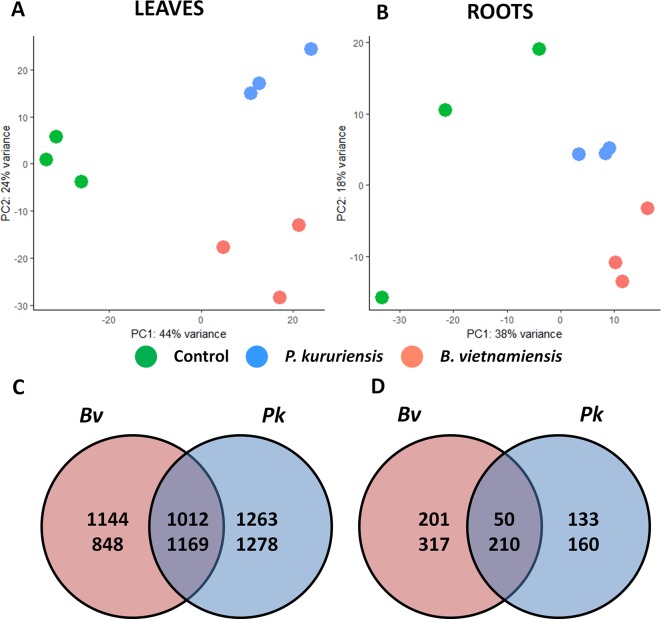
Figure 3.
Comparative analysis of leaves and roots transcriptomes in response to Bv and Pk colonization. Principal component analysis of the normalized number of reads mapped per gene in leaves (A) and in roots (B). Number of genes regulated in leaves (C) and in roots (D) following bacterial inoculation, FDR < 0.01. The numbers on the upper part correspond to the number of genes up-regulated, inversely for the number of down-regulated genes. Bv, Burkholderia vietnamiensis TVV75T; Pk, Paraburkholderia kururiensis M130; FDR, false discovery rate.

