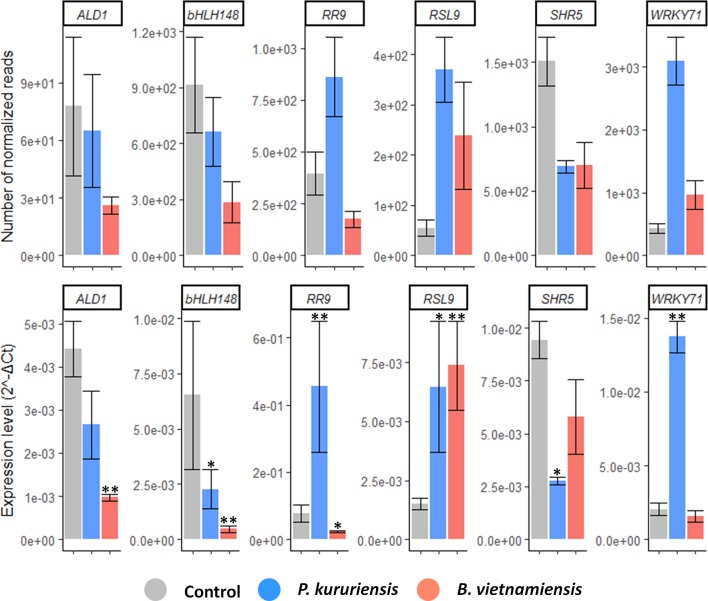
Figure 5.
Confirmation of genes regulated upon Bv and Pk colonization. Gene expression quantified by RNAseq (top) and quantitative reverse transcriptase–polymerase chain reaction (qRT-PCR; bottom). For RNAseq, the data presented are the mean count of normalized reads. For qRT-PCR, transcript levels were normalized to that of the reference gene EF 1α (Os03g0177400). Stars represent significant differences of mean expression compared with the control condition according to post-hoc test on a generalized linear model. * corresponds to p < 0.05 and ** to p < 0.0001. Error bars represent the standard deviation (n = 3). Bv, Burkholderia vietnamiensis TVV75T; Pk, Paraburkholderia kururiensis M130; DEGs, differentially expressed genes.

