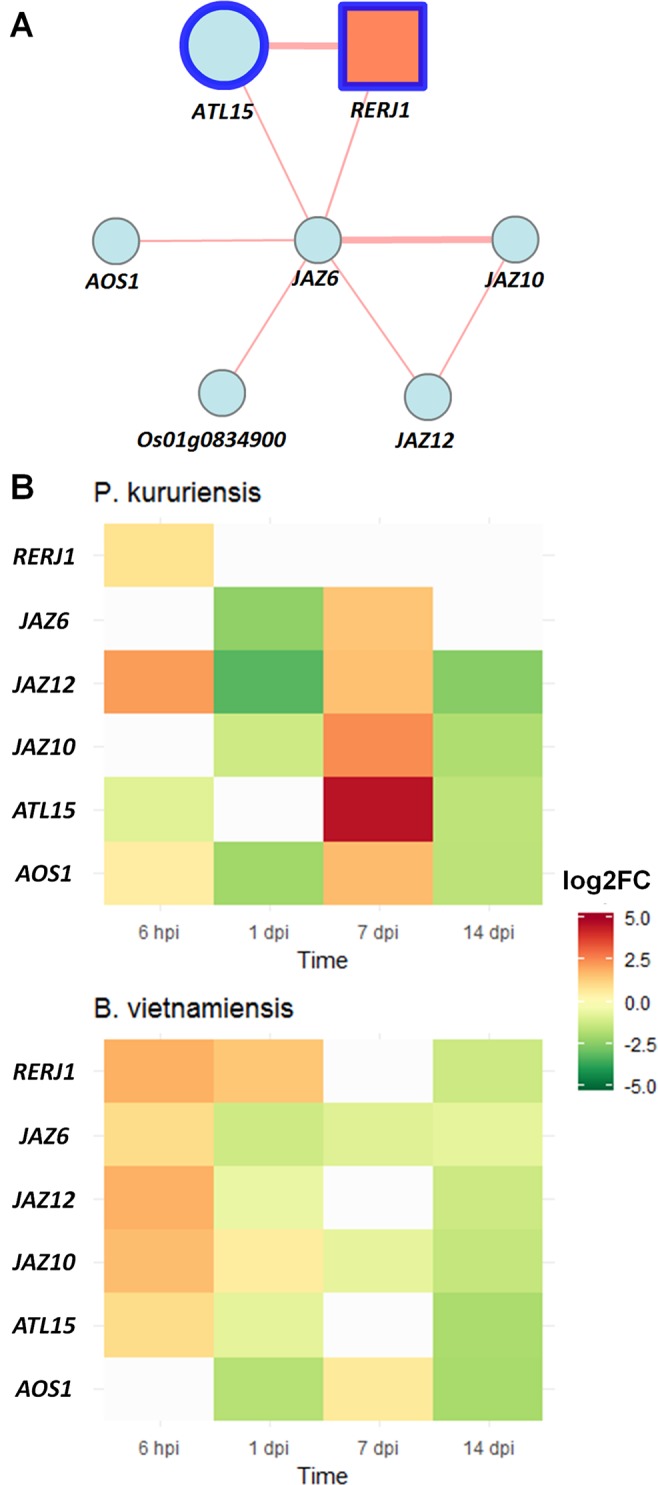
Figure 6.

JA-related co-expression network transcriptional regulations induced by Pk and Bv root colonization. (A) Co-expression network of differential markers (circled in blue); edges’ width is proportional to the co-expression ratio between each gene according to RiceFREND database. (B) Gene expression dynamics of the co-expression network in response to Pk and Bv quantified by qRT-PCR. Transcript levels were normalized to that of reference gene EF 1α (Os03g0177400). Values between 0.5 and −0.5 are colored in gray. Data presented are the mean of log2 fold change (n = 3). JA, jasmonic acid; Bv, Burkholderia vietnamiensis TVV75T; Pk, Paraburkholderia kururiensis M130.
