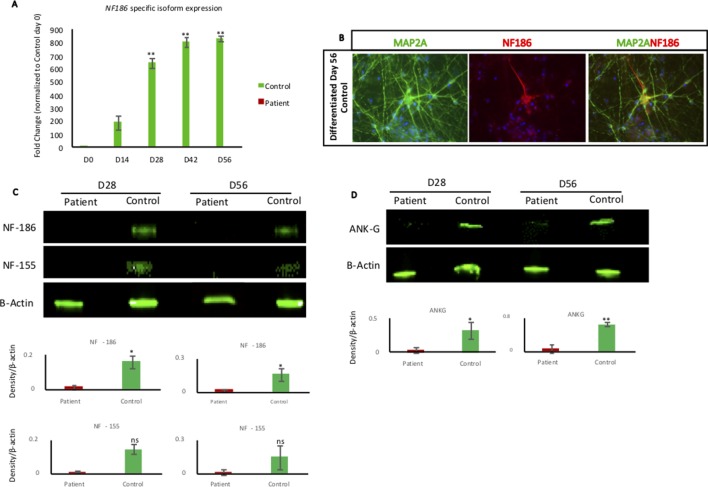
Figure 3.
NF186 isoform expression during neural differentiation. (A) RT-qPCR analysis of NF186 isoform using NESCs (day 0) and collected cells at different time points of differentiation (days 14, 28, 42, and 56) from patient and control. Control cells upregulated NF186 mRNA soon after growth factors removal, while patient cells did not express any NF186 mRNA containing exon 26. Results represented as fold change. Relative expression values were determined after normalizing the mRNA levels to GAPDH and to day 0 of Control. n = 3 biological replicates per cell line per time point. Error bars represented ± standard error of mean; Significance is indicated as *p < 0.05, **p < 0.005. Primers are listed in Supplementary Table 3 . (B) Immunofluorescent staining of NF186 and MAP2A in 56-day-old neuronal differentiation culture of control cells. NF186 expression was excluded from the dendrite marker MAP2A. Scale bar 50 µm. (C) Western blot indicating the expression of NF186 and NF155 in patient and control cells at days 28 and 56 of neuronal differentiation. Densitometry analysis showed significant reduction of NF186 in patient cells, while NF155 reduction was not significant at both days of analysis. Protein expression was normalized to expression of β-actin. (D) Western blot showing expression of ankyrin-G in patient and control cells at days 28 and 56 of differentiation. Densitometry analysis showed significant reduction of ankyrin-G in patient cells at day 28 (p ≤ 0.05) and day 56 (p ≤ 0.001). Protein expression was normalized to expression of β-actin. n = 3 biological replicates per cell line per time point. Error bars represented ± standard error of mean; Significance is indicated as *p < 0.05, **p < 0.001, ns, not significant.

