Figure 4.
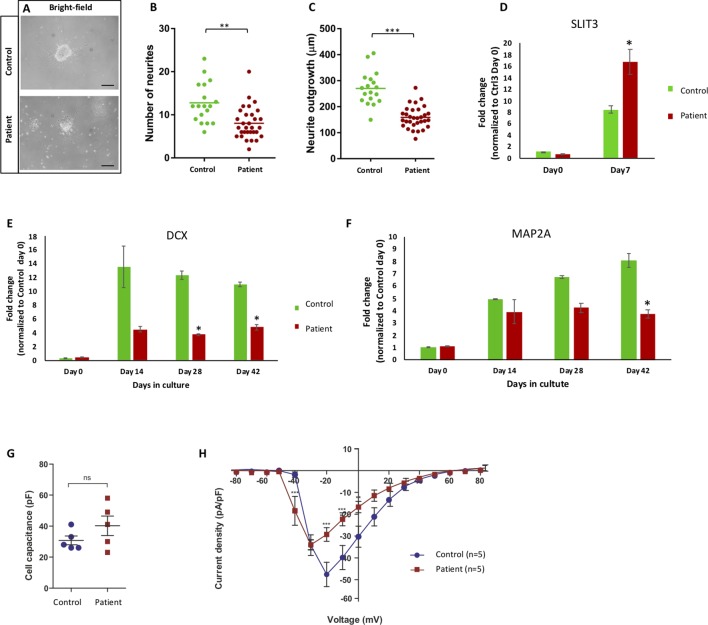
Aberrant neurite extension and different sodium channel recording. (A) Bright-filed microscopy of control and patient Matrigel-embedded neurospheres. (B, C) Graphs from quantified data analysis representing number and length of neurites from control and patient neurospheres. (B) Number of emerging neurites from patient neurospheres was significantly fewer than control. (C) Average length of patient neurites was significantly shorter that control neurospheres. Each dot represents the average number of neurites or neurite length per neurosphere, and the vertical line represents the mean per cell line. Significance is indicated as *p < 0.05; **p < 0.005; ***p < 0.000. (D) mRNA expression of SLIT3 during differentiation in NESC (day 0) and day 7 from patient (III:4) and control lines. Patient cells significantly upregulated SLIT3 mRNA upon 1-week differentiation. (E, F) mRNA expression of neuronal differentiation markers DCX and MAP2A at NESC (day 0) and differentiation time points (days 14, 28, and 42) in control and patient cell lines. Patient cells expressed less MAP2A and DCX compared to control upon differentiation. (G) Capacitance measurements to compare cell sizes between iPSC-derived neurons from control (Ctrl, blue circles) and patient (red squares). Unpaired t test with Welch’s correction (control n = 5, patient n = 5) indicates similar capacitance for neurons from both lineages. (H) Current-voltage relationship of whole-cell currents of iPSC-derived neurons from control (Ctrl) and patient. Data points represent average sodium current density [INa (pA)/size of the cell (pF)] as a function of the membrane potential (mV). The current density in cells derived from patient is reduced when compared to those of control (**p < 0.001; ***p < 0.000). In addition, Na+ current is activated at a 10-mV more negative membrane potential in neurons derived from patient when compared to those from control. Statistical analysis was performed by two-way ANOVA following Bonferroni posttest (Ctrl3 n = 5, III:4 n = 5). All errors: ± standard error of mean.

