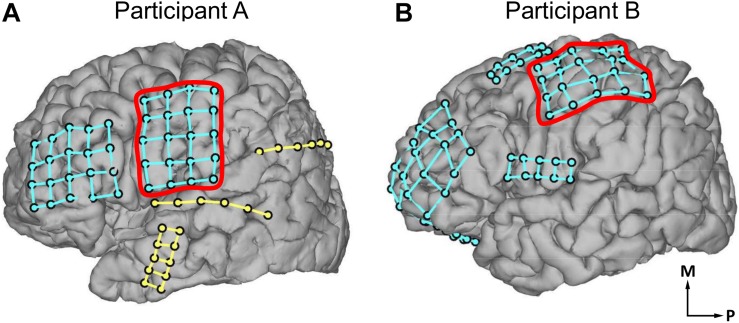
FIGURE 1.
Locations of electrocorticogram electrodes on participants’ cortical surfaces as determined by coregistration of MRI and CT images. Electrode locations are visualized with dots, with different electrode grids distinguished by the presence of grid lines between those dots. (A) Electrode locations in participant A. (B) Electrode locations in participant B. In (A,B), red outlines indicate the electrode grids analyzed in the current study. The outlined electrode grid was on the left hemisphere of the brain for participant A, and the right hemisphere for participant B; participant B’s data has been mirrored throughout this report for comparison. Axes labels indicate medial (M) and posterior (P) directions.

