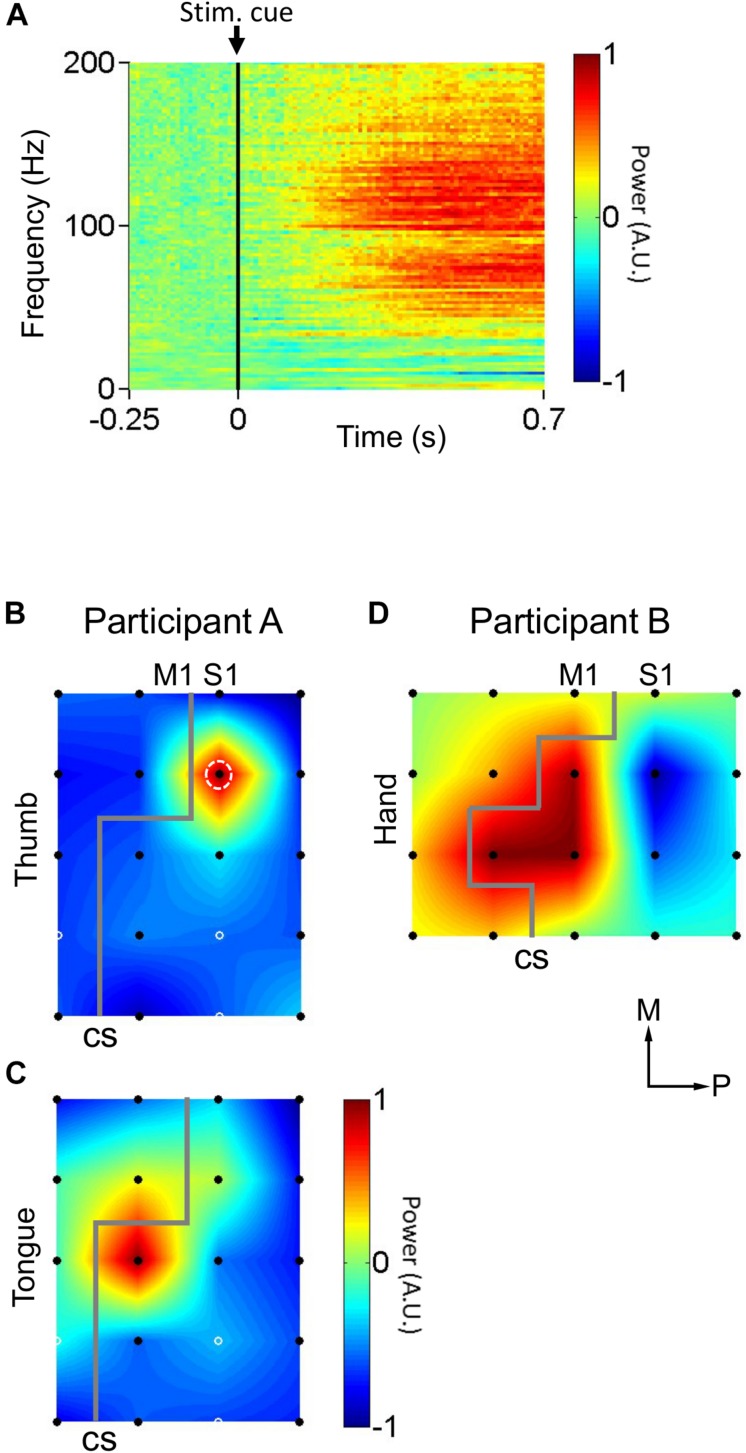
FIGURE 2.
Cortical responses to peripheral mechanical stimulation. (A) Average cortical responses upon mechanical stimulation of the thumb in participant A (n = 50 trials). Participant A’s thumb were rubbed by a cotton swab. Black vertical lines indicate stimulus instruction onset (Stim. cue). (B) Distribution of cortical responses (n = 50 trials) to mechanical stimulation of the thumb in participant A. White dashed circle indicates the electrode whose cortical response is detailed in (A). (C) Distribution of cortical responses (n = 50 trials) to mechanical stimulation of the tongue in participant A. (D) Distribution of cortical responses (n = 40 trials) to mechanical stimulation of the hand in participant B. Gray lines indicate estimated location of central sulci (CS). Black filled circles indicate electrodes where cortical responses were calculated. White solid circles indicate electrodes where the signal was corrupted by noise, and for where for display purposes the cortical response was taken as the mean of the neighboring electrodes’ responses. Axes labels indicate medial (M) and posterior (P) directions. The color scale in (B–D) is the same as in (A). A.U. stands for arbitrary units.

