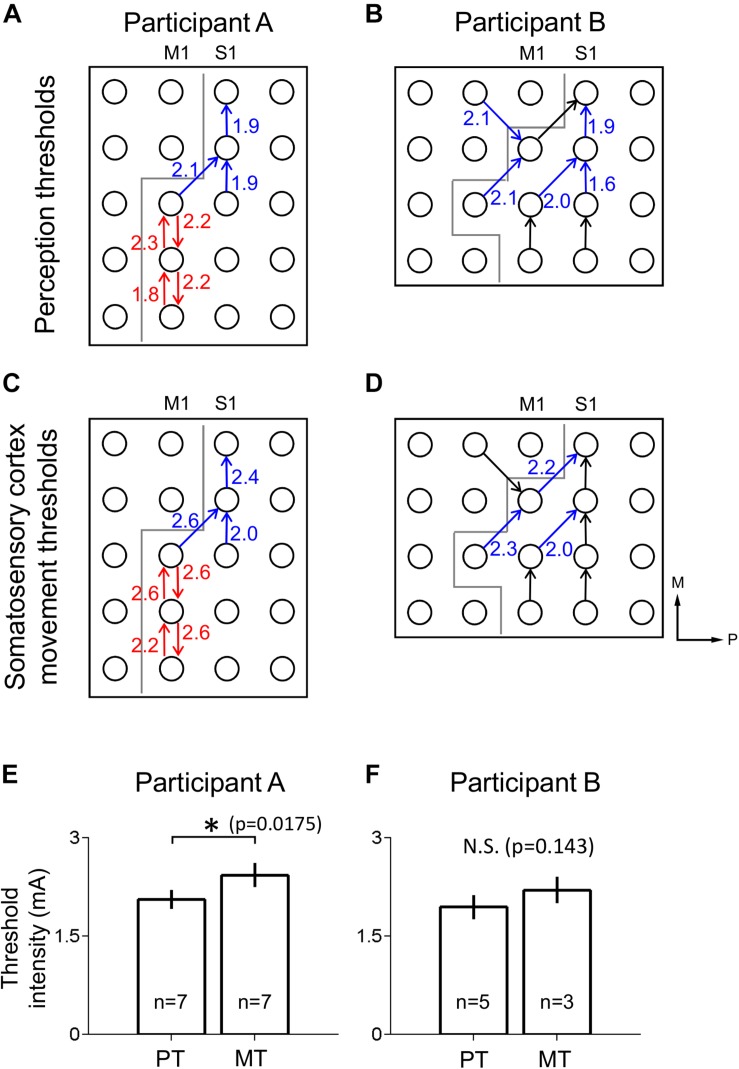
FIGURE 3.
Thresholds for perception and movement evoked by S1 stimulation. (A,B) Perception thresholds (PT) at different electrodes for participants A (A) and B (B) in mA. Arrows point from anode to cathode indicating stimulation polarity (blue: the electrode pairs which induced thumb sensation, red: the electrode pairs which induced tongue sensation, black: no response). Gray line indicates estimated location of central sulcus, dividing M1 and S1. (C,D) As in (A,B), but with movement threshold (MT) under S1 stimulation. Axes labels indicate medial (M) and posterior (P) directions for (A–D). (E) Comparison of perception (PT) and movement (MT) thresholds in S1 for participant A using a two-tailed Mann–Whitney U-test with a significance criterion of p < 0.05. Bars and error bars indicate mean and standard error respectively. (F) As in (E), for participant B. ∗Indicates significance at the 0.05 level, and N.S. indicates non-significance.

