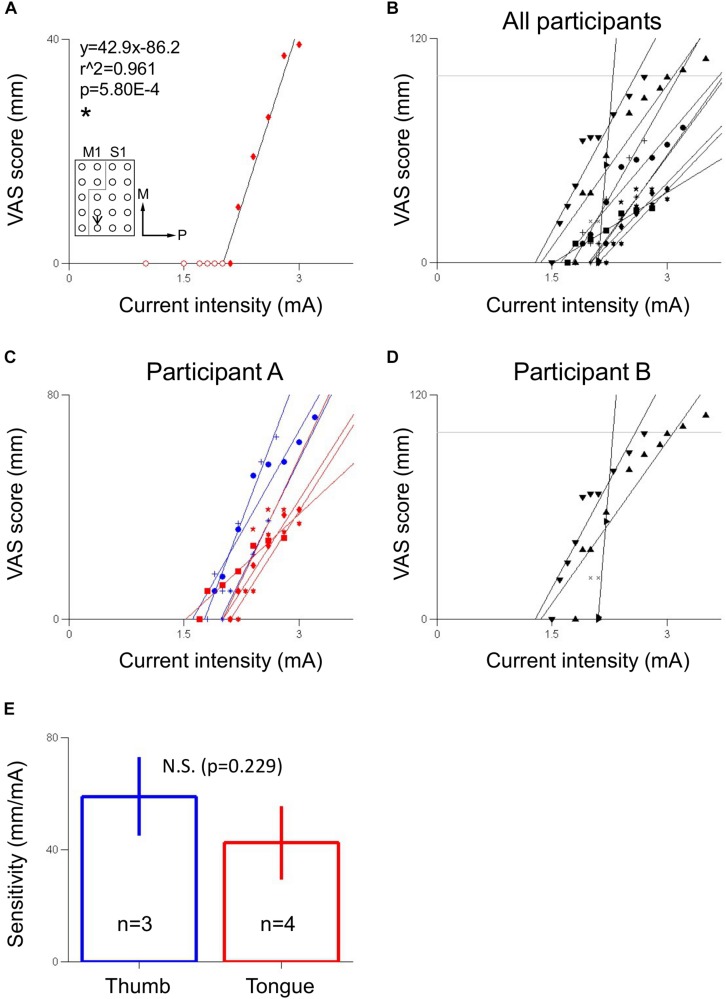
FIGURE 4.
Relationship between S1 stimulation current intensity and VAS score of evoked sensation. (A) Electrode pair showing a linear relationship between visual analogue scale (VAS) score, which corresponded to sensation of a hard object on the tongue, and current intensity in participant A. Inset indicates location of stimulated electrode pair. Black arrow points from anode to cathode indicating stimulation polarity. Gray line indicates estimated location of central sulcus. Numerals in inset indicate coefficient of correlation (r2) and p-value (p). Equation describes VAS score (y) in mm as a function of current intensity (x) in mA. The slope of the line is the sensitivity of the electrode pair in mm/mA. ∗Indicates significance at the p < 0.05 level. Fitting ignores redundant-pre threshold points, indicated by hollow circles. Axes labels indicate medial (M) and posterior (P) directions. (B) VAS score versus current intensity for electrodes across both participants. (C) VAS score versus current intensity for electrodes in participant A, differentiated by perceived body area (blue: thumb, red: tongue). (D) VAS score versus current intensity for electrodes in participant B, corresponding to hand sensation. In (B,D), horizontal gray line indicates the 100 mm “strongest sensation” endpoint of the VAS. In (C,D), redundant pre-threshold points (open circles in A) have been removed for clarity. (E) Comparison of sensitivities between thumb and tongue areas in participant A using a two-tailed Mann–Whitney U-test with a significance criterion of p < 0.05. Bars and error bars indicates mean and standard error, respectively. N.S. indicates non-significance.

