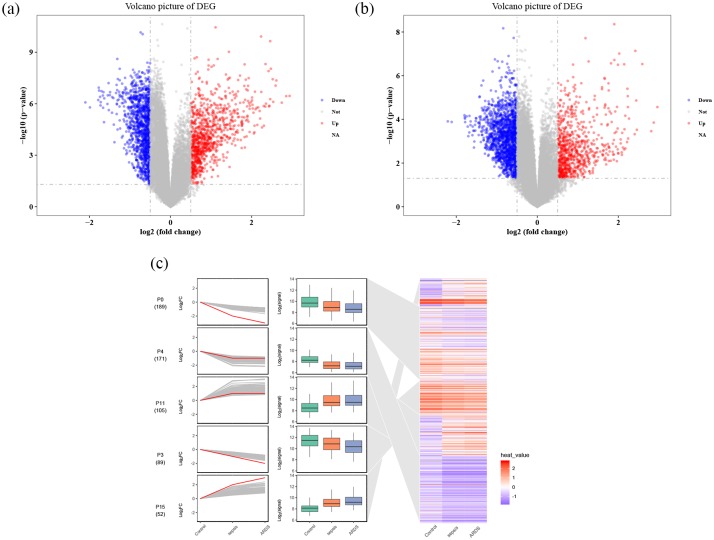
Figure 3.
DEG analysis and STEM. (a) DEGs in sepsis samples, red represents upregulated genes, blue represents downregulated genes, and gray represents no significantly DEGs. (b) DEGs in sepsis-induced ARDS samples. (c) STEM figure of DEGs, red is the fitted curve, which means gene cluster in sepsis-induced ARDS cut trend, and the blue area means gene cluster in the positions of the heat.
ARDS, acute respiratory distress syndrome; DEG, differentially expressed genes; STEM, short time-series expression miner.

