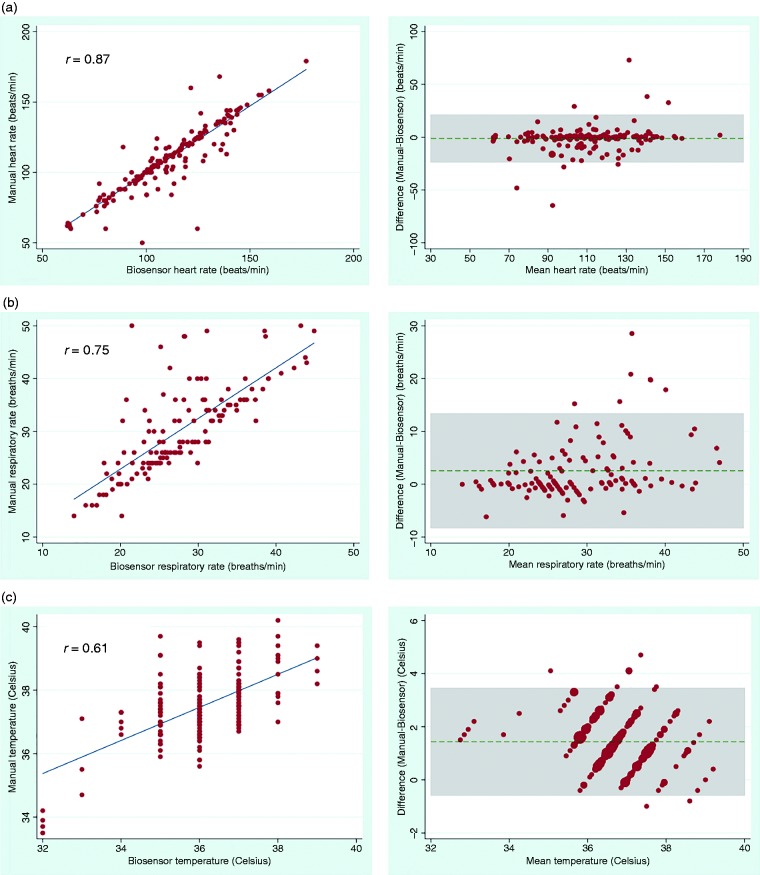
Figure 2.
Correlation scatterplots (left) and Bland–Altman plots (right) for (a) heart rate, (b) respiratory rate and (c) temperature comparing biosensor measurements and manual measurements obtained by a research nurse. Horizontal dashed lines in the Bland–Altman plots indicate the mean differences (bias) and shaded areas indicate 95% limits of agreement.

