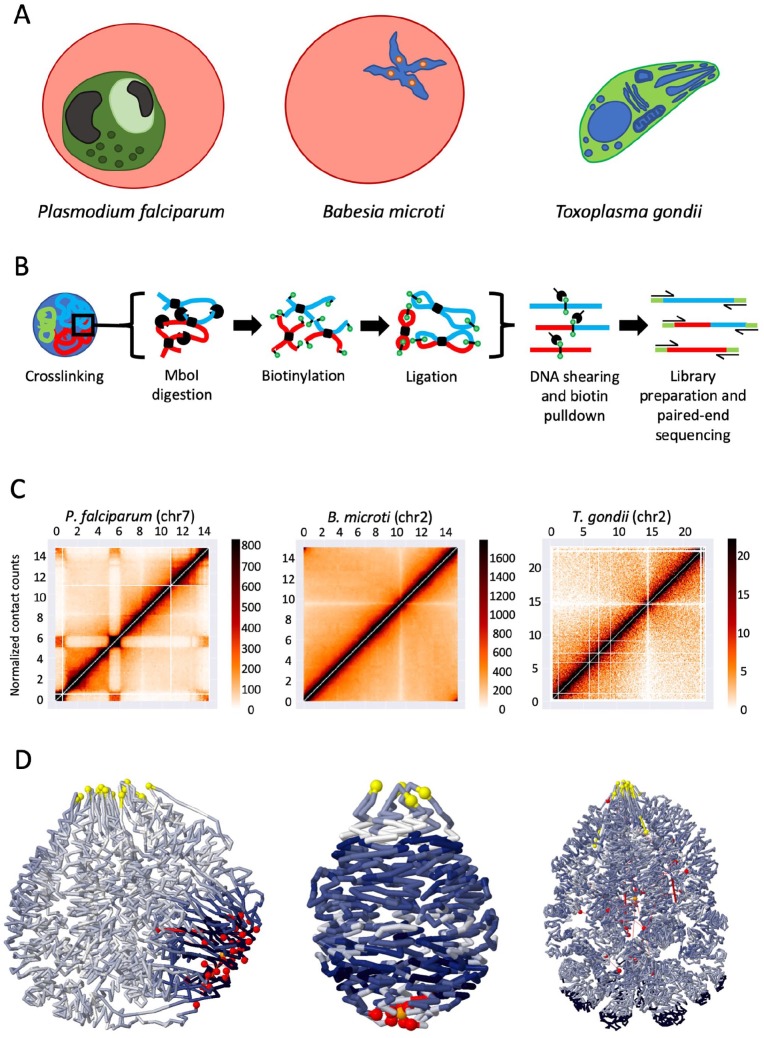
Figure 1.
Experimental workflow of sampled species with a corresponding intrachromosomal heatmap and 3D genome model: (A) simplified models of 3 species studied in the experiment; (B) overview of the in situ Hi-C protocol; (C) intrachromosomal contact count heatmaps corresponding to species shown in (A), with domain-like structure shown in P. falciparum chr7 due to internal var genes; and (D) PASTIS 3D models of entire genomes corresponding to species shown in (A), using a gradient of dark blue to white to represent areas of low to high gene expression, respectively. Yellow spheres represent centromeres, and telomeres are shown as red spheres.

