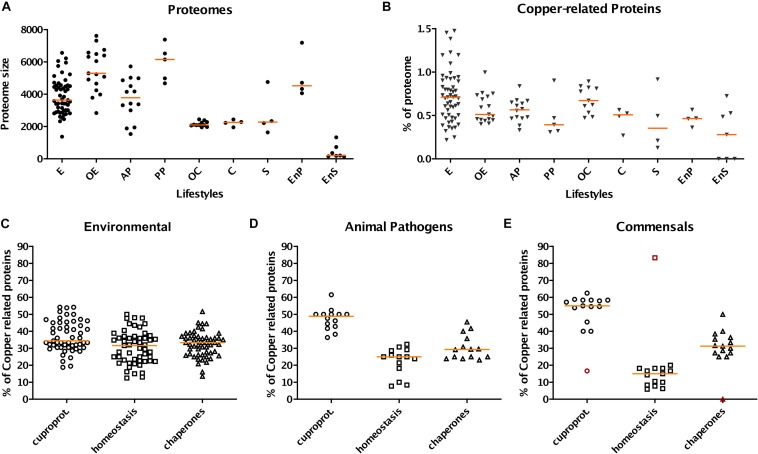
FIGURE 1.
Profiles of copper-related proteomes as a function of the lifestyles of β proteobacteria. The bacteria were grouped according to their lifestyles, and various data were extracted from their predicted proteomes. E, OE, AP, PP, OC, C, S, EnP, and EnS represent environmental, opportunistic/environmental, animal pathogen, phytopathogen, opportunistic/commensal, commensal, symbiotic, endophytic, and endosymbiotic bacteria, respectively. (A) Sizes (in numbers of proteins) of the total proteomes as a function of the lifestyles of β proteobacteria. (B) Proportions (in%) of the copper-related proteomes relative to the entire proteomes. The copper-related proteomes include all predicted proteins of the three categories described in the text (cuproproteins, copper-homeostasis proteins, and copper chaperones). (C–E) Proportions of cuproproteins, copper-homeostasis proteins, and copper chaperones relative to the copper-related proteomes in selected bacterial groups, namely environmental bacteria (C), animal pathogens (D), and commensals (E). Note that in panel E both commensals and commensals/opportunists were included in order to increase the number of species in that group. The red symbols in panel E correspond to O. formigenes. In each panel, the different species are each represented by one symbol. The orange horizontal lines represent the medians of the values for the various groups.

