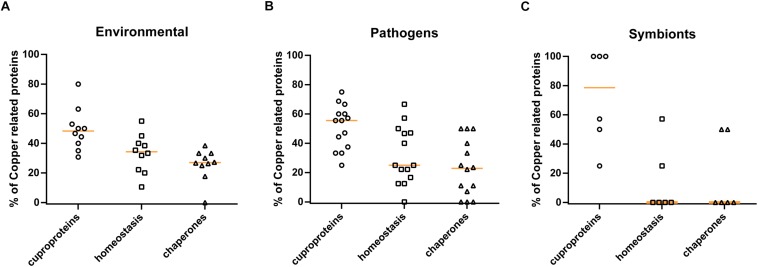
FIGURE 7.
Profiles of copper-related proteomes as a function of the lifestyles of other proteobacteria. The predicted copper-related proteomes of a sample of α and γ proteobacteria were analyzed. The 30 species used in this analysis and their full sets of data are shown in Supplementary Table S3. Three groups (panel A: environmental species, panel B: pathogens, and panel C: symbionts) were made according to lifestyles, and the proportions (in%) of cuproproteins, copper-homeostasis proteins, and copper chaperones relative to the complete copper-related proteomes were determined for each species. The orange horizontal lines represent the medians of the values for the various groups.

