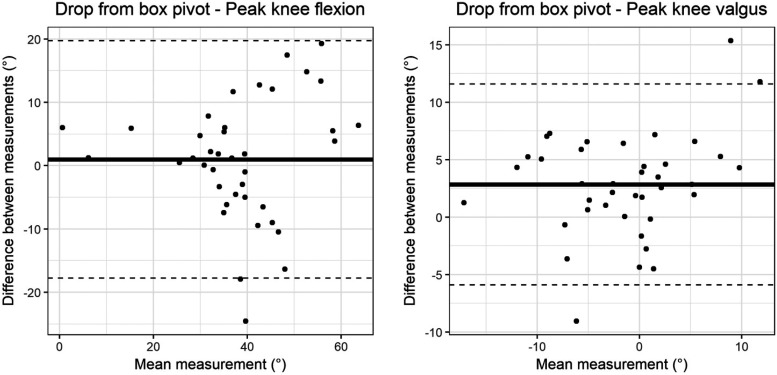
Figure 4.
Bland Altman plot of knee flexion (left) and valgus (right) for jump from box, landing on both legs then pivoting. The x-axis represents the mean value of the measurement, and the y-axis the difference between systems. The bold horizontal line is the mean difference between systems while the dashed horizontal lines are the 95% limits of agreement.

