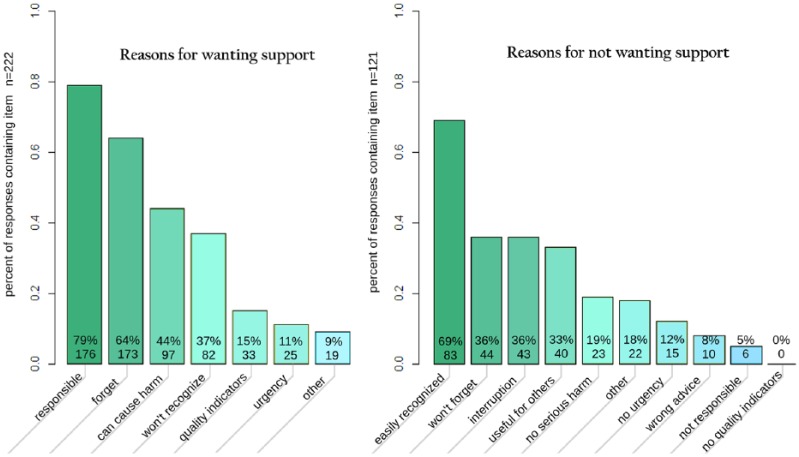
Figure 3.
Frequency of selection of reasons for wanting or declining support. Respondents could choose any number of reasons, no reasons, or fill in a free-text field (“other”). Percentages are the percentage of responses which included this item. The full text of the reasons is given in Tables 3 and 4.

