Figure 3.

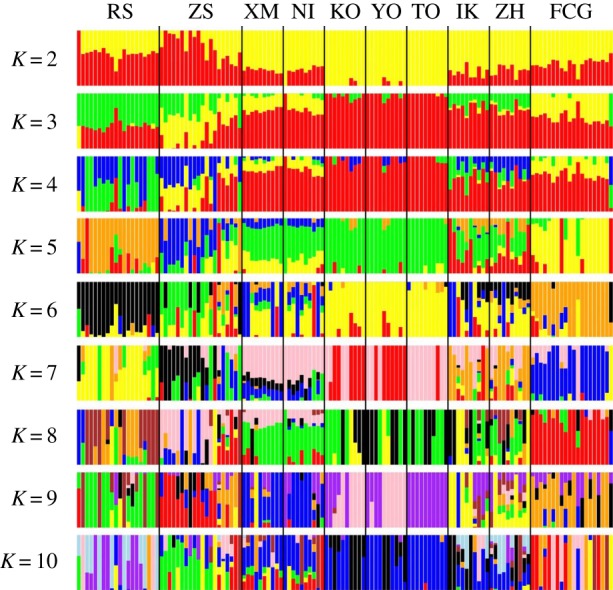
Population admixture analysis of 10 S. marmoratus populations based on the non-outlier dataset. Each bar represents an individual and each colour is inferred membership in each of the K (2–10) potential ancestral populations.

Population admixture analysis of 10 S. marmoratus populations based on the non-outlier dataset. Each bar represents an individual and each colour is inferred membership in each of the K (2–10) potential ancestral populations.