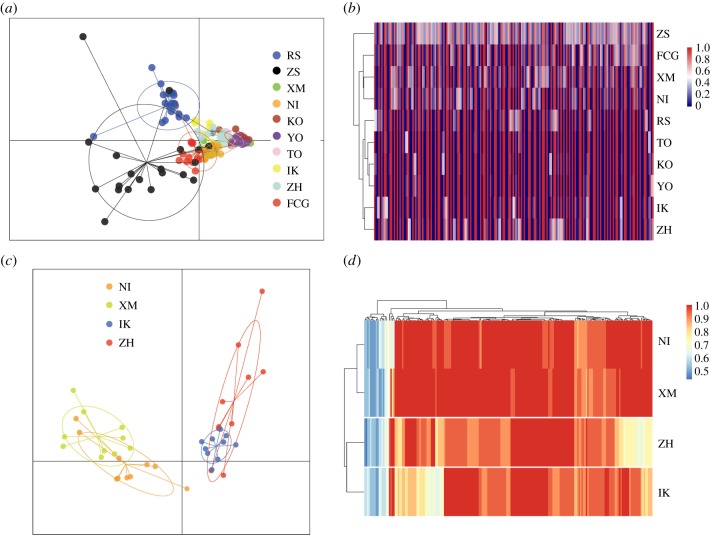
Figure 5.
PCA plots and clustering of allele frequencies based on outliers. Hierarchical clustering was implemented in heatmap using Euclidean distance with the Ward clustering method. (a) PCA plotting in 10 populations; (b) allele frequency clustering in 10 populations; (c) PCA plotting in populations XM, ZH, NI and IK; (d) allele frequency clustering in populations XM, ZH, NI and IK.

