Figure 2.
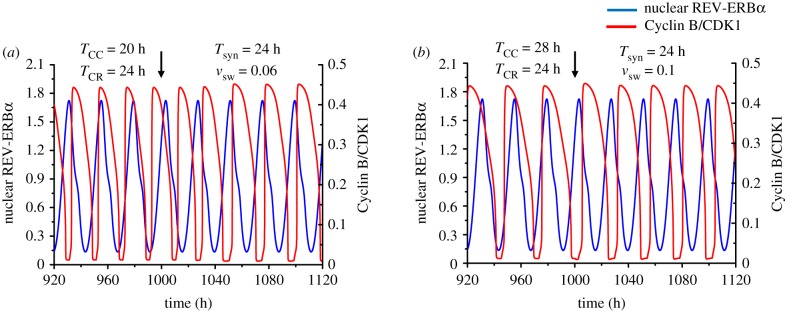
Unidirectional coupling of the cell cycle to the circadian clock. The time series show the entrainment of the cell cycle by the circadian clock when the autonomous period of the cell cycle (TCC) is 20 h (a) or 28 h (b), while the autonomous period of the circadian rhythm (TCR) is 24 h. In both cases the cell cycle can be entrained to oscillate with a period of 24 h when it is unidirectionally coupled to the circadian clock via induction of Wee1 by BMAL1, starting at the time marked by the vertical arrow. Before coupling begins, the time series show the cell cycle and the circadian clock oscillating independently at their autonomous period. The strength of coupling of the cell cycle to the circadian clock, vsw, is equal to 0.06 µMh−1 in (a) and 0.1 µMh−1 in (b). The scaling parameter eps used to fix the cell cycle period is equal to 21.58 in (a) and 15.35 in (b). The blue curve represents the time evolution of nuclear REV-ERBα (a circadian variable) while the red curve represents the time evolution of Cyclin B/CDK1 (a cell cycle variable). For this and subsequent figures, parameter values are given in the electronic supplementary material. (Online version in colour.)

