Figure 5.
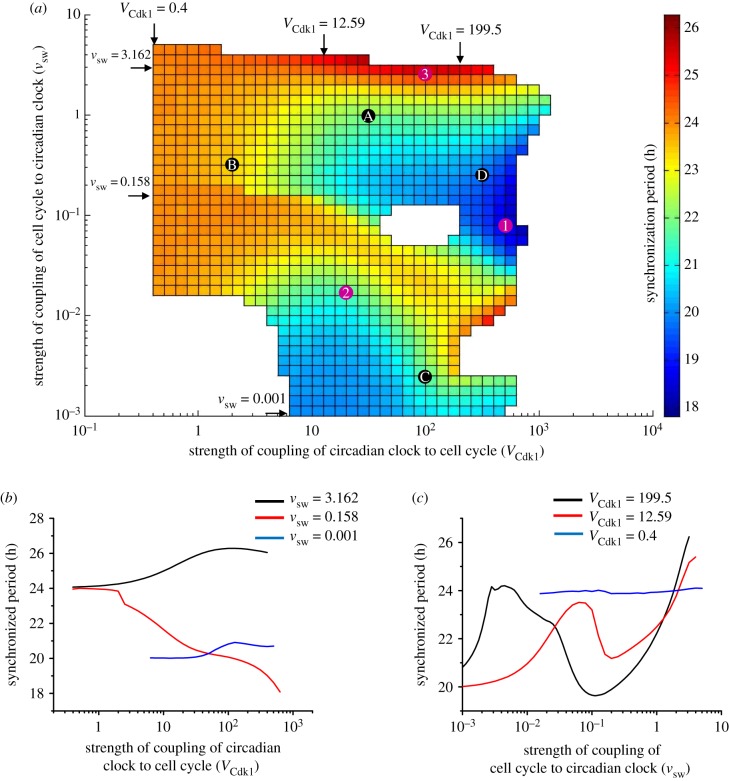
Bidirectional coupling: dependence of the synchronization period on the relative strengths of coupling of the cell cycle and the circadian clock. The cell cycle is coupled to the circadian clock through BMAL1 induction of Wee1 while the circadian clock is linked to the cell cycle through REV-ERBα phosphorylation by CDK1. (a) Heat map showing how the period of synchronization varies as a function of the strength of coupling of the cell cycle to the circadian clock (vsw, in μMh−1) and of the strength of coupling of the circadian clock to the cell cycle (VCdk1, in nMh−1). The diagram is established for an autonomous period TCC = 20 h for the cell cycle and TCR = 24 h for the circadian clock. Coloured regions indicate synchronization in the form of simple periodic oscillations; the colour code for the synchronization period, on the right, ranges from 17.8 to 26.3 h. Points marked 1, 2 and 3 refer to the synchronized oscillations shown in figure 4b, c and d, respectively. Points marked A, B, C and D correspond, respectively, to the situations considered in figure 6a–d. (b) Three horizontal sections through the heat map in (a) as a function of the strength of coupling of the circadian clock to the cell cycle, VCdk1, at decreasing values of the strength of coupling of the cell cycle to the circadian clock, vsw. For vsw = 3.162, or 0.158, as VCdk1 increases, the period of synchronization ranges, respectively, from 24.1 h to 26.3 h (black curve) or from 24 h to 18.1 h (red curve), while it remains close to 20 h when vsw = 0.001 (blue curve). (c) Three vertical sections through the heat map in (a) as a function of the strength of coupling of the cell cycle to the circadian clock, vsw, at decreasing values of the strength of coupling of the circadian clock to the cell cycle, VCdk1. For VCdk1 = 199.5 or 12.59, the synchronization period ranges from 19.65 to 26.23 h (black curve) or from 20 to 25.39 h (red curve) as vsw increases, while it remains close to 24 h when VCdk1 = 0.4 (blue curve). (Online version in colour.)

