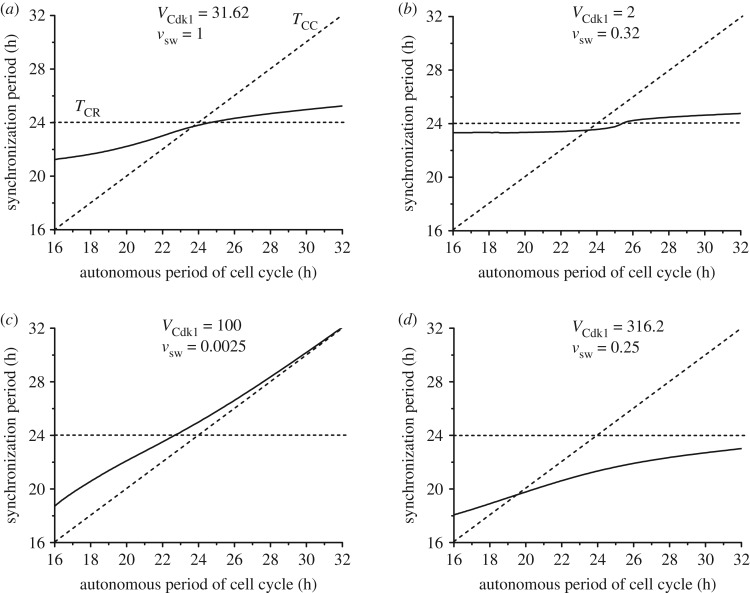
Figure 6.
Bidirectional coupling: dependence of the synchronization period on the autonomous period of the cell cycle, TCC. As in figures 4 and 5, the cell cycle is coupled to the circadian clock through BMAL1 induction of Wee1 while the circadian clock is linked to the cell cycle through REV-ERBα phosphorylation by CDK1. The autonomous period of the circadian clock TCR is fixed at 24 h, while the autonomous period of the cell cycle increases from 16 to 32 h (by changing the scaling parameter eps from 26.9 to 13.4; see Section 1 in the electronic supplementary material). The values of the coupling strengths VCdk1 (in nMh−1) and vsw (in μMh−1) are of comparable magnitude in (a) (VCdk1 = 31.62, vsw = 1), while in (b) the coupling of the circadian clock to the cell cycle is weaker (VCdk1 = 2, vsw = 0.32). In (c) the coupling of the circadian clock to the cell cycle is much stronger than the reverse coupling (VCdk1 = 100, vsw = 0.0025), as in (d) where the curve was obtained for larger values of the two coupling strengths (VCdk1 = 316.2, vsw = 0.25). In each panel the synchronization period Tsyn (solid line) increases gradually with TCC. The horizontal and diagonal dashed lines correspond, respectively, to Tsyn = TCR and Tsyn = TCC. All synchronized oscillations are of the simple periodic type with one peak of each variable per period. The data in (a), (b), (c), and (d) correspond, respectively, to the points marked A, B, C and D in figure 5a.

