Figure 1.
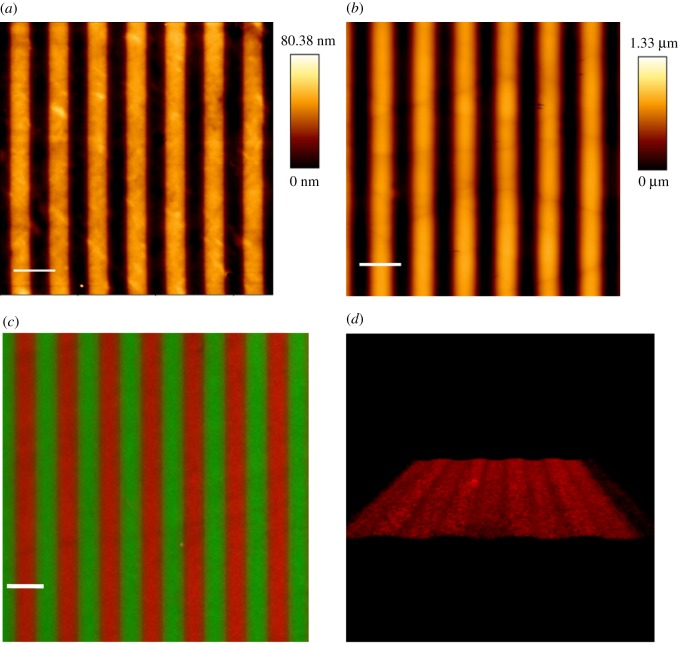
Bio-adhesive and topographic patterned surface characterization: atomic force microscopy images of (a) µP substrates and (b) µG substrates. The 5 µm wide dark stripes represent the adhesive stripes (a) and the groove surfaces (b), while the 5 µm wide orange stripes represent the PLL-PEG anti-adhesive areas (a, thickness 45 nm) and the ridge surfaces (b, depth = 1 µm). Scale bar is 10 µm. (c) Epifluorescent images of FITC-PLL-PEG (green) and rhodamine-fibronectin (red) coated µP surfaces. Scale bar is 10 µm. (d) Three-dimensional reconstruction of z-scanning confocal microscopy images of µG surface coated with rhodamine-fibronectin (red). (Online version in colour.)

