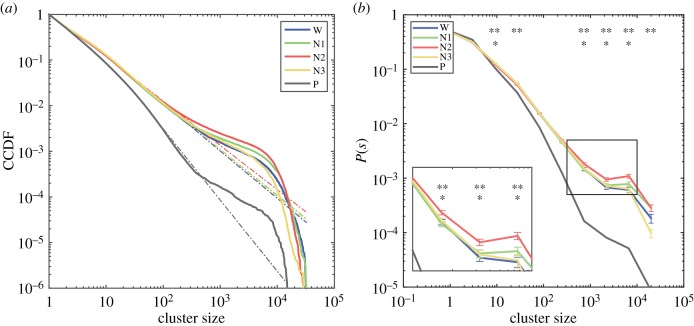
Figure 2.
Distributions of cluster sizes. (a) The complementary cumulative distribution functions (CCDFs) for cluster sizes (colour coded for wakefulness, N1, N2 and N3 sleep). (b) The normalized probability density functions for cluster sizes (colour coded as in (a)). The inset zooms in to the tail of the distributions, where significant effects of stage on P(s) were found (** significant effect of sleep stage on P(s), * significant difference of P(s) between wakefulness and N2 sleep). (Online version in colour.)

