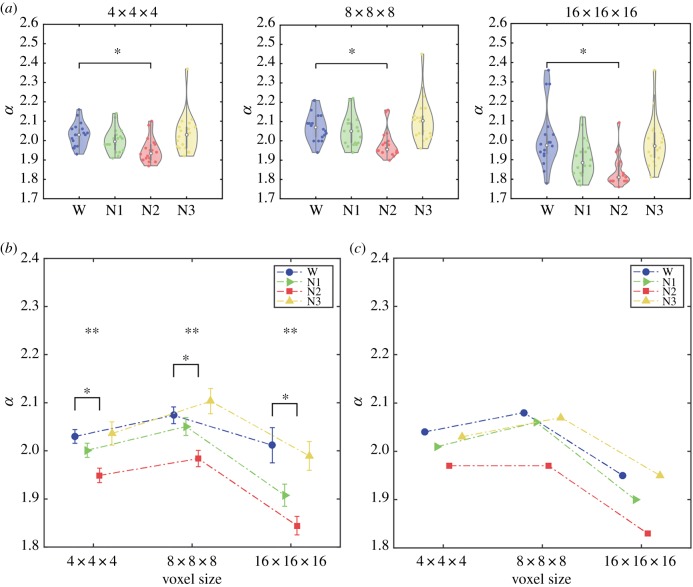
Figure 3.
Scaling parameter α for different granularities of the data. (a) Violin plots of α values. A significant effect of sleep stage on α was found for all resolutions (4 × 4 × 4: p = 0.0012; 8 × 8 × 8: p = 0.0002; 16 × 16 × 16: p < 0.0001). Post hoc tests showed that α decreased from wakefulness to N2 sleep for all resolutions (4 × 4 × 4: p = 0.0018; 8 × 8 × 8: p = 0.0018; 16 × 16 × 16: p = 0.0006). (b) Means and standard errors of α for each resolution. ANOVA tests revealed a significant effect of stage across all resolutions (4 × 4 × 4: p = 0.0029; 8 × 8 × 8: p = 0.0007; 16 × 16 × 16: p = 0.0002). (c) Scaling parameter values α for cluster size distributions obtained by pooling values for all subjects. (Online version in colour.)

