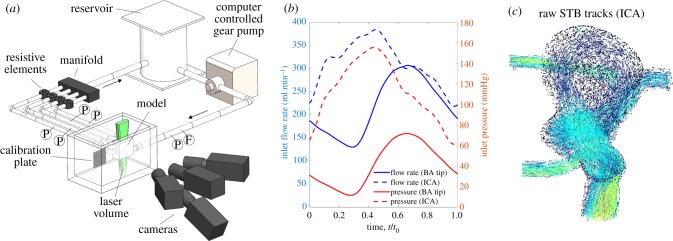
Figure 2.
(a) Schematic of the flow loop set-up, including the camera and calibration plate. F indicates locations of ultrasonic flowmeters and P indicates locations of pressure transducers. (b) Inflow flow rate and pressure taken from the upstream flowmeter and pressure transducer for both geometries. The phase of the pulsatile cycle is displayed as it was extracted from 4D flow MRI. (c) Sample STB tracks for the ICA geometry. (Online version in colour.)

