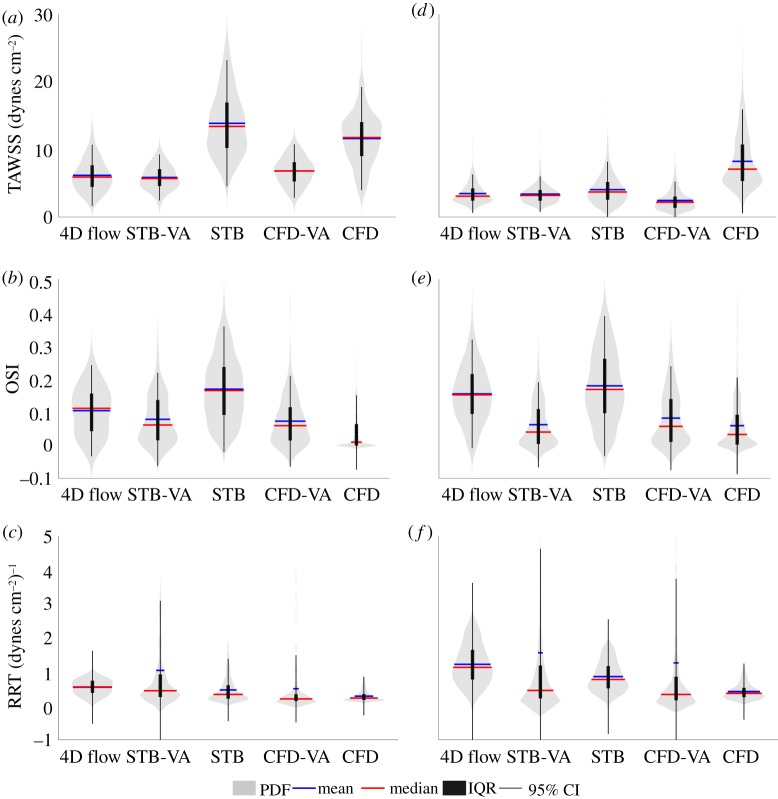
Figure 5.
Distribution of (a) TAWSS, (b) OSI and (c) RRT in the basilar tip aneurysm, where the width of PDF shows relative distribution density. Distribution of (d) TAWSS, (e) OSI and (f) RRT in the ICA aneurysm. The mean and median values, IQRs and 95% CIs are indicated. Violin plots were made from code adapted from [39]. (Online version in colour.)

