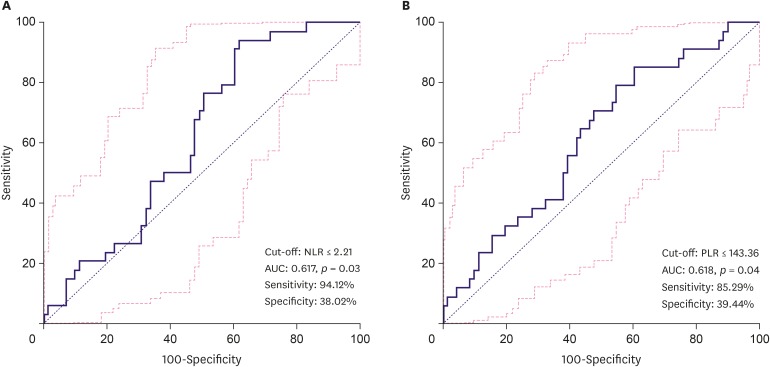
Figure 1. ROC curve analysis for the cut-off value to predict NAC response (A) cut-off value of NLR (B) cut-off value of PLR. NLR cut-off was ≤ 2.21 with 94.1% sensitivity and 38.0% specificity. PLR cut-off was ≤ 143.36 with 85.3% sensitivity and 39.4% specificity.
ROC = receiver operating characteristic; NAC = neoadjuvant chemotherapy; NLR = neutrophil-lymphocyte ratio; PLR = platelet-lymphocyte ratio.

