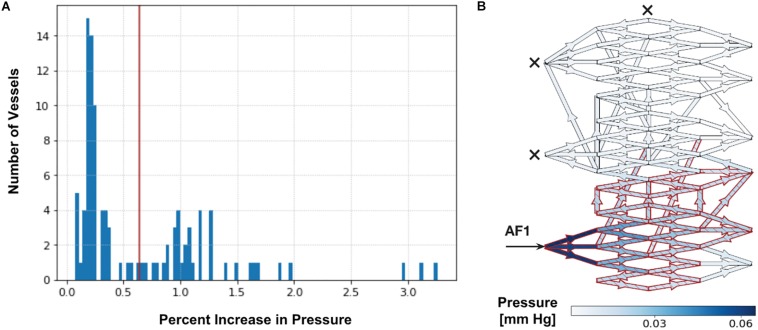
FIGURE 2.
Determination of intranidal compartment size. (A) Tabulated results for Pmean above baseline (ΔP%) are first displayed graphically as a histogram. An example here illustrates a histogram of ΔP% values in intranidal vessels following a 20 mm Hg injection SSA into AF1 with simultaneous occlusion of all other AFs (as described in Supplementary Table 3). A bimodal distribution can be observed. The red line indicates the threshold value of ΔP% determined by Otsu’s method. Vessels with a ΔP% above this threshold (38% of nidus vessels) are considered part of a compartment. (B) Simulated distribution of Pmean throughout nidus vessels during a 20 mm Hg injection pressure SSA performed through AF1, with occlusion of all other AFs. Arrow indicates injection site and crosses indicate occluded AFs. Blue indicates nidus vessels experiencing a ΔP%. Superimposed red indicates nidus vessels forming part of the compartment served by the injected AF, as determined by Otsu’s method. Color scale shows range of ΔP% in mmHg. The ΔP in the plots is the change in pressure during injection over the non-injection state; it is a difference in pressure, and therefore has units of mm Hg. The ΔP is not a pressure drop across each vessel. The ΔP is useful to plot because it shows the change in pressure due to injection across the network, which depends on the flow and resistance throughout the network, structure of the network, and the site of injection.

