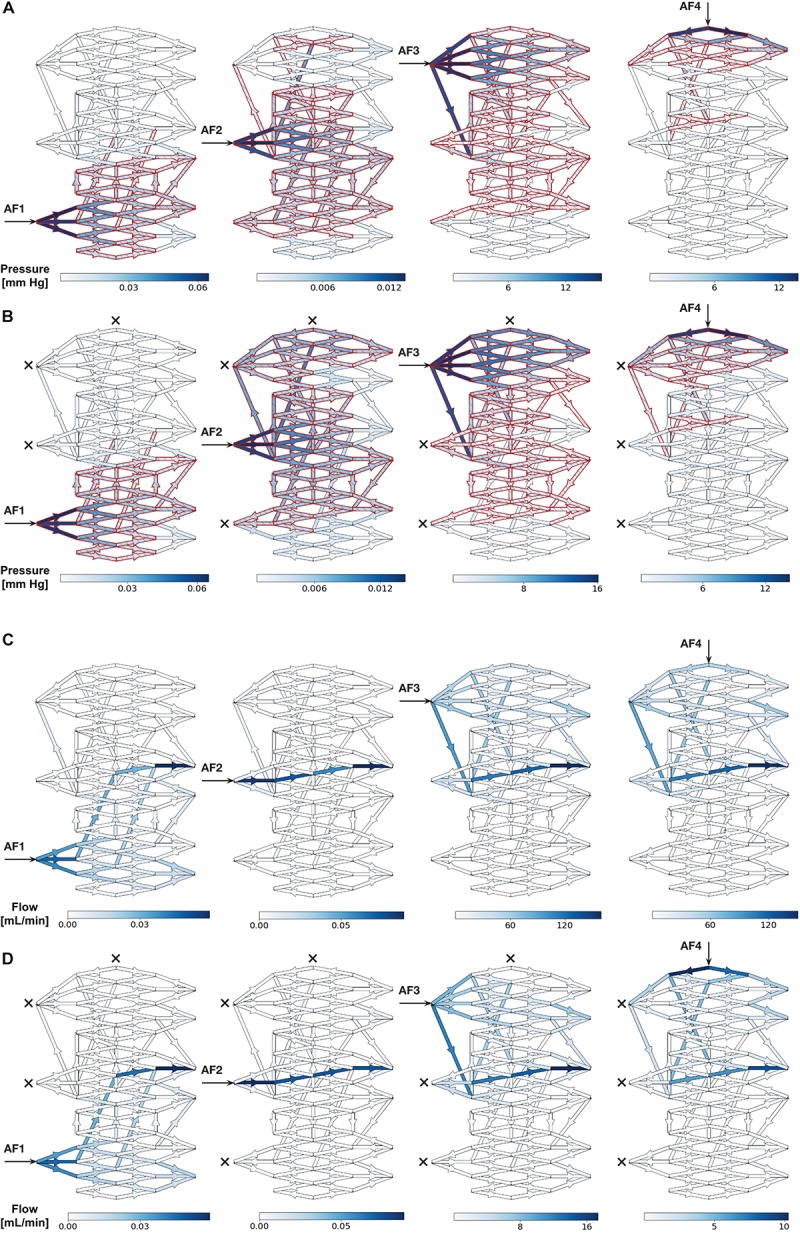
FIGURE 3.

(A,B) Simulated distribution of Pmean throughout nidus vessels during SSA with a 20 mm Hg injection applied sequentially to each AF. (A) Each AF injection simulated without occlusion of any other AF. (B) Each AF injection simulated with occlusion of all other AFs. Arrows indicate injection site and crosses indicate occluded AFs. Blue indicates nidus vessels experiencing a change in Pmean above baseline (ΔP%). Superimposed red indicates nidus vessels forming part of the compartment served by the injected AF, as determined by Otsu’s method. Color scale shows range of pressures in mmHg. (C,D) Simulated distribution of flow throughout nidus vessels during SSA with a 20 mm Hg injection applied sequentially to each AF. (C) Each AF injection simulated without occlusion of any other AF. (D) Each AF injection simulated with occlusion of all other AFs. Arrows indicate injection site and crosses indicate occluded AFs. Blue indicates nidus vessels experiencing a change in flow above baseline (ΔFlow%). Color scale shows range of flows in mL/min.
