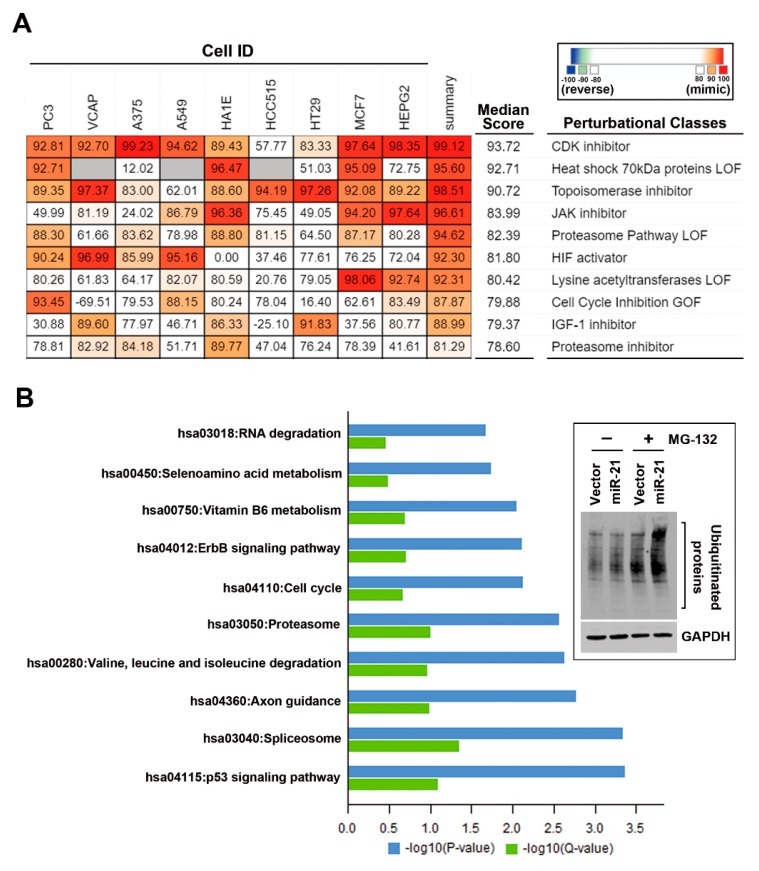
Figure 4.
Microarray analysis of DLD-1-miR-21 cells. The total RNA isolated from DLD-1-vector and DLD-1-miR-21 cells was subjected to a microarray analysis as described in “Materials and Methods”. Differentially expressed genes (DEGs) were prepared for the next-generation Connectivity Map (CMap) analysis (A) and Kyoto Encyclopedia of Genes and Genomes (KEGG) pathway enrichment analysis (B). In (A), the top 10 most similar perturbational classes to miR-21 overexpression are shown. The gray grids indicate “not measured”. In (B), the top 10 enriched pathways are plotted on the Y-axis versus a measure of significance (negative logarithm of the p value or Q-value) on the X-axis. The Q-value was calculated by Benjamini. Embedded figure in (B): DLD-1-vector and DLD-1-miR-21 cells were treated with or without 10 μM MG132 for 4 h. Whole-cell lysates were prepared and subjected to Western blot analysis.

