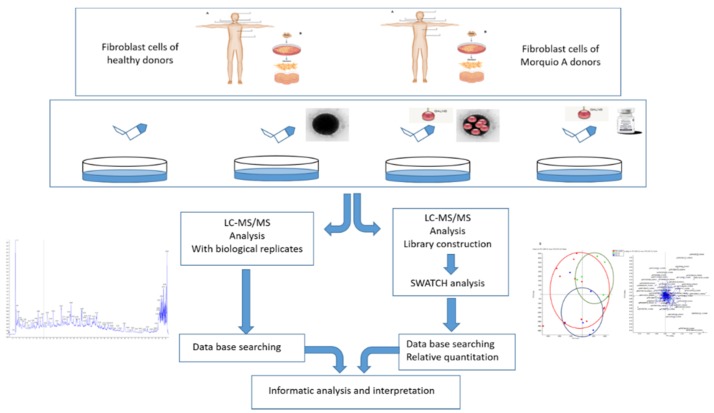
Figure 11.
Graphical abstract showing the workflow. Fibroblasts obtained from healthy subjects and morquio A patients were cultured in vitro. After 24 h of treatment, cells were lysed and proteomic analyses were done. On the left, the identified proteins expressed by the cells (qualitative analysis) are shown. On the right, the amount of specific proteins expressed by the cells (quantitative analysis) are shown. Once this two different proteomics assessments were performed, an informatics analysis was made in order to obtain more information (localization, pathways, interactions…) about the identified/quantified proteins.

