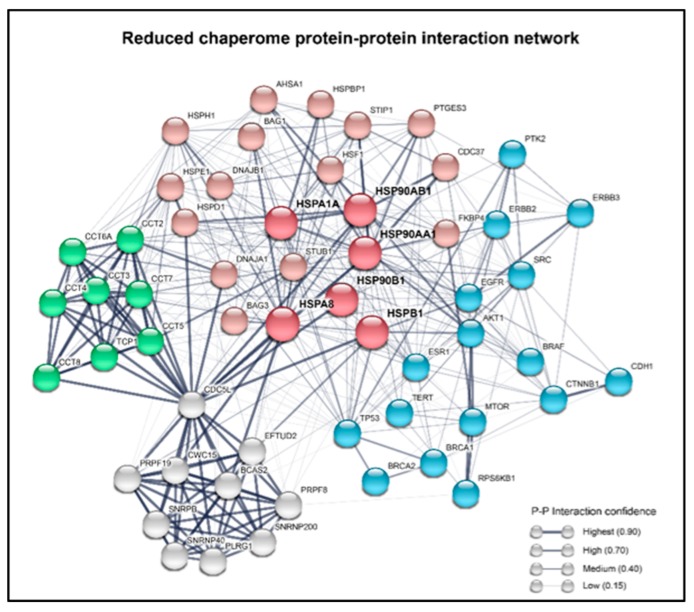
Figure 3.
A reduced chaperome network is shown with the representation of the physical connections between the chaperome and the various proteins that can powerfully influence tumorigenesis. A summary of the protein–protein interaction network of the major HSPs. In the network, the nodes represent the most important constituents of the chaperome, which are connected with other proteins by edges of varying width. Red nodes are code for the main HSPs and co-chaperones, blue are well known cancer-related genes, the TRiC complex genes are shown in green, and the Prp19/CDC5L complex genes are in grey. The line thickness of the edges indicates the strength of the experimental data supporting a protein–protein interaction. The network was built using the STRING database (https://string-db.org) from the Swiss Institute of Bioinformatics and the European Molecular Biology Laboratory (EMBL).

