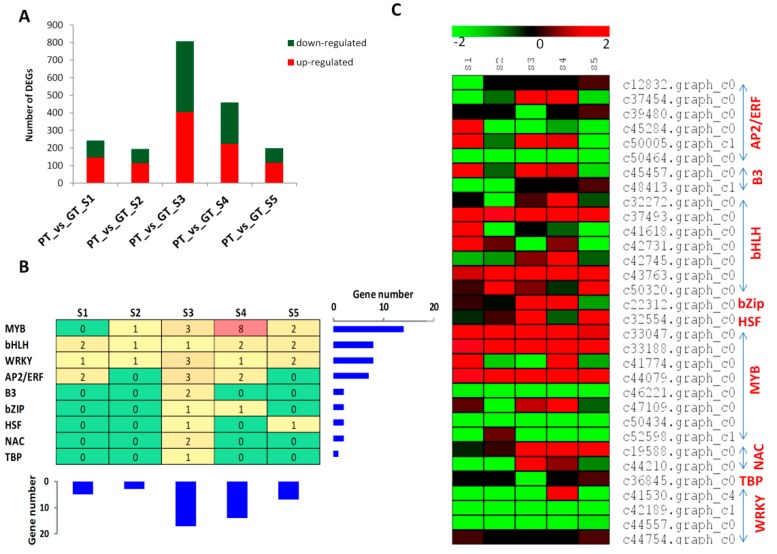
Figure 3.
Transcription factors (TF) regulating the gene expression between the two turnips. (A) Number of up- and down-regulated genes between PT and GT at different developmental stages S1-S5. PT represents the purple turnip while GT represents the green turnip; (B) overview of the enriched TF family. The combined histograms showed the number of occurrence of genes belonging to each TF family or at each developmental stage; (C) Heatmap displaying the expression fold change (Log2 fold change) between PT and GT for the gene encoding transcription factors.

