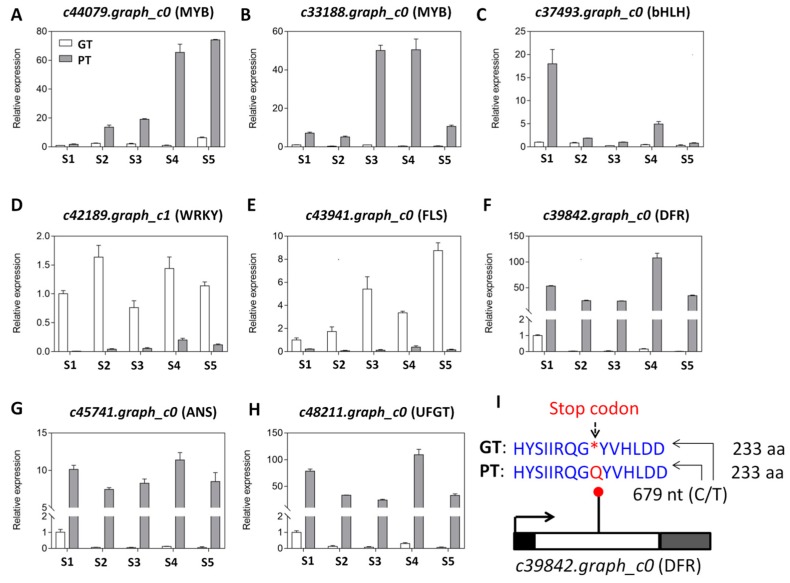
Figure 7.
Quantitative real time PCR validation of selected candidate genes predicted to differentially affect the anthocyanin profiles in the two turnips. (A–H) Relative expression level of c33188.graph_c0 (MYB), c44079.graph_c0 (MYB), c37493.graph_c0 (bHLH), c42189.graph_c1 (WRKY), c43941.graph_c0 (FLS), c39842.graph_c0 (DFR), c45741.graph_c0 (ANS) and c48211.graph_c0 (UFGT) between PT and GT at five developmental stages (S1–S5). PT represents the purple turnip while GT represents the green turnip and are represented by the grey and white bars, respectively. The error bar represents the SD of biological replicates. The Actin gene was used as the internal reference gene for normalization; (I) identification of a non-sense mutation in the gene c39842.graph_c0 (DFR) by comparing the sequences between PT and GT. The single nucleotide polymorphism (C/T) is located at the position 679 within the coding sequence of the gene and is predicted to generate an amino acid (aa) Q in PT while a stop codon in GT. The white box represents the exon while the black and gray boxes represent the UTR5′and UTR3′, respectively. The arrow indicates the transcription start site and transcription orientation.

