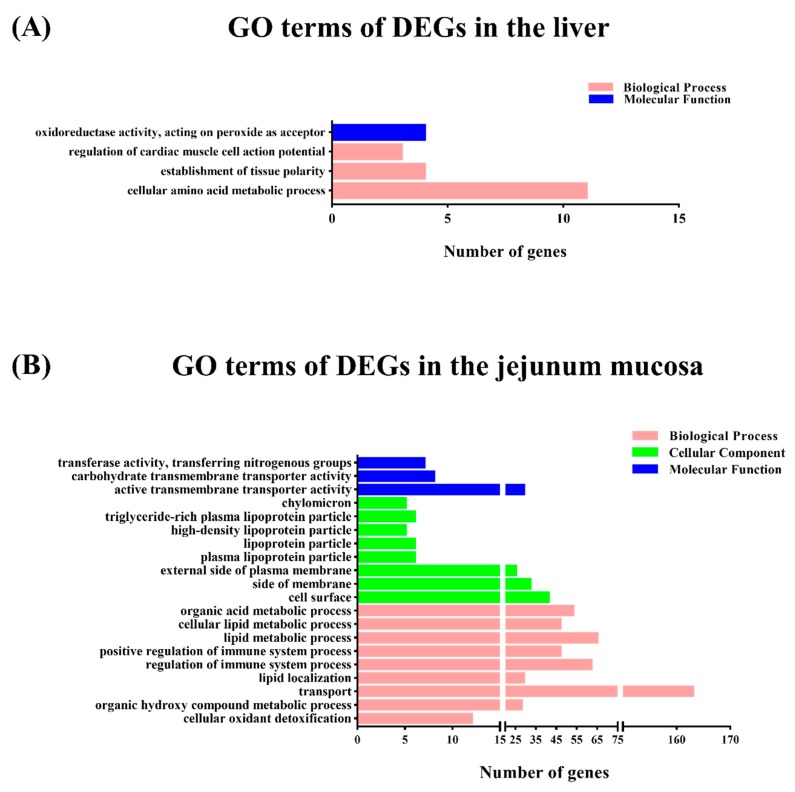
Figure 1.
Function classifications of Gene Ontology (GO) terms of differential expressed transcripts between the one meal per day (M1) and two meals per day (M2) groups. A p value < 0.05 and fold change (FC) ≥ 1.5 were used as thresholds to select significant GO categories. The green bars indicate the number of differentially expressed genes (DEGs) enriched in molecular function, the blue bars indicate the number of DEGs enriched in cellular component, and the pink bars indicate the number of DEGs in the biological process. (A) Analysis of the GO terms of DEGs in the liver. (B) Analysis of the GO terms of DEGs in the jejunal mucosa.

